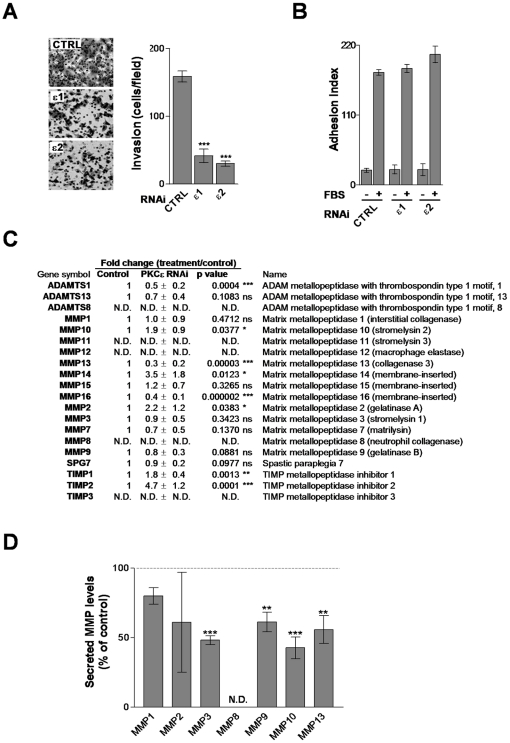
Figure 6. PKCε modulates invasion and ECM-genes in A549 cells.
A. A549 cells were transfected with RNAi for either PKCε (ε1 and ε2) or control (CTRL) and 2 days later serum-starved for additional 24 h. Cells were then seeded in Boyden chambers with Matrigel-coated membranes. Invasion was quantified 24 h later. Left, representative micrographs. Right, quantification of invasive cells. Data are represented as mean ± S.E.M. (n = 3). ***, p<0.001. B. Adhesion to Matrigel-coated plates was determined 24 h after seeding. Data are represented as mean ± S.E.M. (n = 3). C. Analysis of proteases and inhibitors of proteases by qPCR in control or PKCε-depleted cells. Results are expressed as mean ± S.E.M. (n = 4). D. Detection of ECM proteases secreted to conditioned medium (CM) from control or PKCε-depleted A549 cells. Quantification of MMP levels by densitometry is represented as mean ± S.E.M. (n = 3). **, p<0.01; ***, p<0.001. N.D., not-determined.

