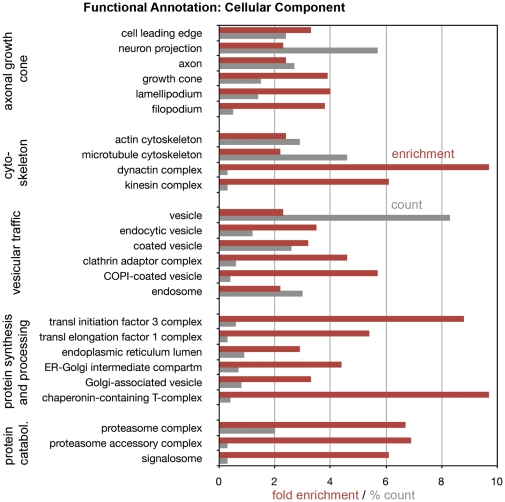
Figure 3. Functional annotation (“Cellular Component”) analysis of the growth cone proteome.
GO Terms are listed in functional groups. Enrichment values (relative to random expression) are shown in red; % count (grey) indicates the number of protein species associated with each GO Term relative to the total number of protein species in net GCPs. For the enrichment values, p<0.01; Benjamini scores <0.05.

