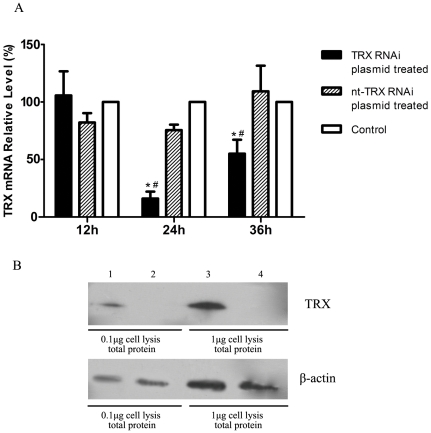
Figure 4. TRX knockdown.
A: The relative level of TRX mRNA was detected by RT-PCR. β-actin was used as the reference control. The mRNA level of control was considered as 100%. The relative level of TRX mRNA was calculated using equation 2−ΔΔCT (n = 3, mean±SD, the symbols, * and #, indicate that a value differed significantly (p<0.05) from the control and nt-TRX RNAi treated groups, respectively.); B: Reduction in TRX protein levels was confirmed by the western blot analysis in Raw264.7 cell. Lane 1 and 3 were nt-TRX RNAi plasmid treated cell lysis, lane 2 and 4 were TRX RNAi plasmid treated cell lysis. All samples were extracted at 24 h after transfection.

