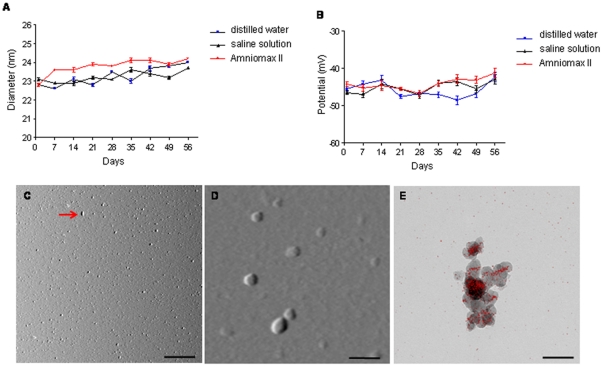
Figure 1. In vitro measurements of SPIOn.
(A) Size distribution and (B) zeta-potential measured in distilled water, saline solution and Amniomax II by DLLS. (C–D) Representative images of SPIOn spotted on the mica and visualized by AFM. (C) SPIOn are mainly monodispersed although a small number of chain-like clusters (red arrow) were found. (D) AFM picture shows the spheroid shape of SPIOn. (E) EFTEM images of SPIOn. Single particles were detectable, despite aggregation caused by magnetic forces, confirming data obtained by AFM. Red spots indicate the ESI analysis for iron. Scale bars: C = 1 µm; D–E = 40 µm.

