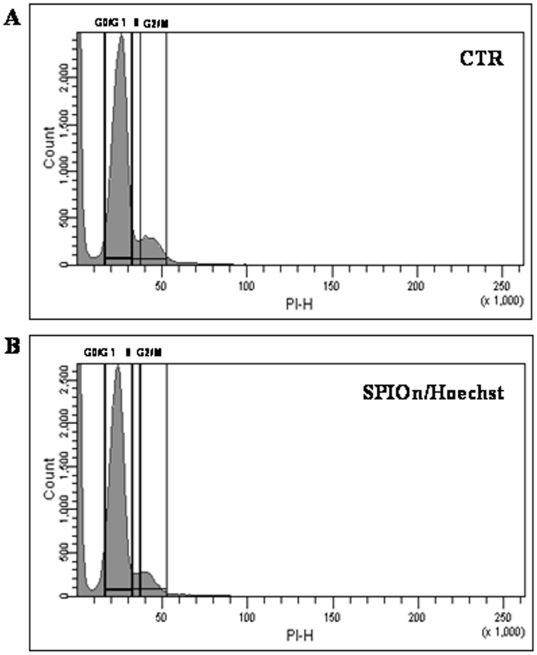
Figure 3. FACS analysis of hAFCs.
Evaluation of cell cycle revealed that there were no differences between unlabeled (A) and SPIOn/Hoechst 33258 positive hAFCs (B). In all, 50,000 events per histogram were analyzed (horizontal axis: linear fluorescence intensity; vertical axis: relative cell number). Additional data are reported in Table 2.

