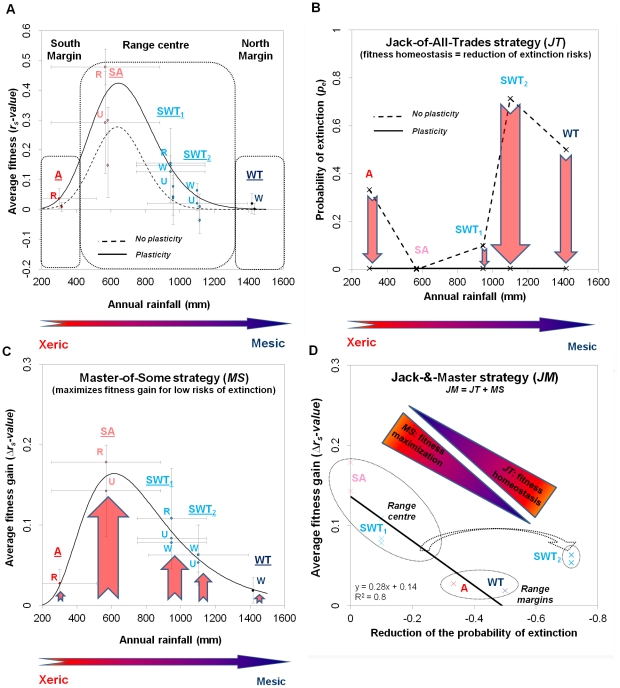
Figure 6. Average individual-level fitness benefits of plasticity.
A) The log-normal distribution between annual rainfall and observed fitness (continuous line, average ± s.d) and fitness if there had been no plasticity (dashed line). B) The Jack-of-All-Trades (JT) strategy as predicted from the distribution between annual rainfall and observed probability of extinction (continuous line) and probability of extinction if there had been no plasticity (dashed line). C) Fitness gain provided by plasticity (average ± s.d). D) The Jack-&-Master (JM) strategy as predicted from the correlation between the reduction of probability of extinction and the average fitness benefits. The probability of extinction was calculated as the proportion of the populations with rs-value<0.

