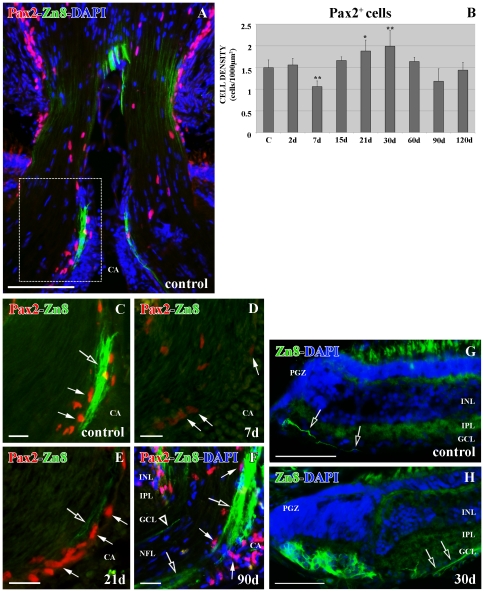
Figure 1. Double immunolabeling Pax2 (red)-Zn8 (green) with DAPI (blue) in the ONH.
(A) Pax2+ cells are arranged close to the Zn8+ young RGC axons throughout the control ONH. Square enlarged in C. (B) Statistical analysis of the Pax2+ cell density in the ONH during regeneration. The asterisk indicates the significant differences (*0.05<p<0.01) and the two asterisks highly significant differences (**p<0.01). N = 4 animals per group. (C) Detail of the optic disc showing Pax2+ (arrows) close to the Zn8+ young RGC axons (empty arrow). (D) Detail of the optic disc 7 d after injury showing the Pax2+ cells barely labeled (arrows). (E) Detail of the optic disc 21 d after injury showing the Pax2+ cells (arrows) close to the Zn8+ regenerating axons (empty arrow). (F) Detail of the optic disc 90 d after injury showing Pax2+ cells (arrows) close to the Zn8+ regenerating axons in the growing edge (empty arrows) and in the mature ONH (empty arrowhead). (G) Zn8+ RGC axons (empty arrows) in the control PGZ. (H) Zn8+ RGC axons (empty arrows) in the PGZ 30 d post-lesion. Scale bars: A: 100 µm; C–F: 20 µm; G–H: 50 µm. CA: central artery; GCL: ganglion cell layer; INL: inner nuclear layer; IPL: inner plexiform layer; NFL: nerve fiber layer; PGZ: proliferative growth zone.

