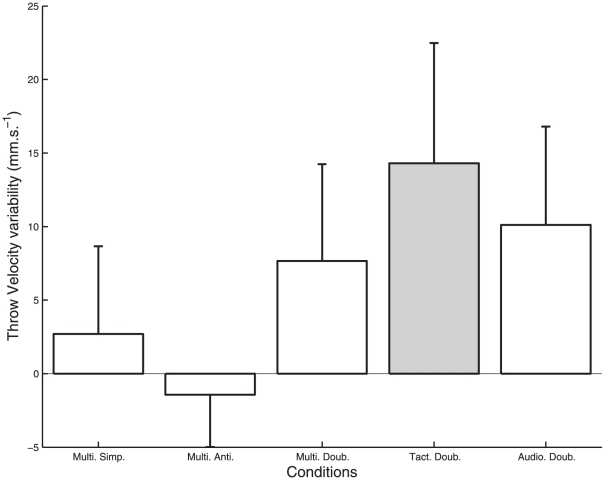
Figure 3. Variability of throw velocity (ThVel) for each metronome condition.
The average variability for each individual in the control condition defined the individual baseline variability, which was subtracted to the individual's average variability in each metronome condition. Thus, the zero corresponds to the baseline variability without metronome. Negative values indicates smaller variability than in the control condition. Error bars represent inter-participant standard deviation. The grey bar indicates a significant increase in the variability of throw velocity in the Tact. Doub. metronome condition.

