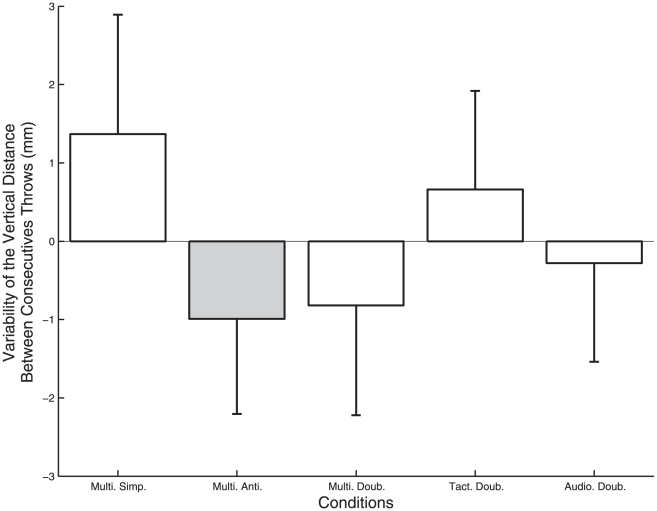
Figure 5. Variability of the vertical distance between consecutives throws (DBTz) for each metronome condition.
Zero corresponds to the baseline variability without metronome, and the error bars represent inter-participant standard deviation. The grey bar indicates a significant decrease in the variability of the vertical distance between consecutives throws in the Multi. Anti. metronome condition.

