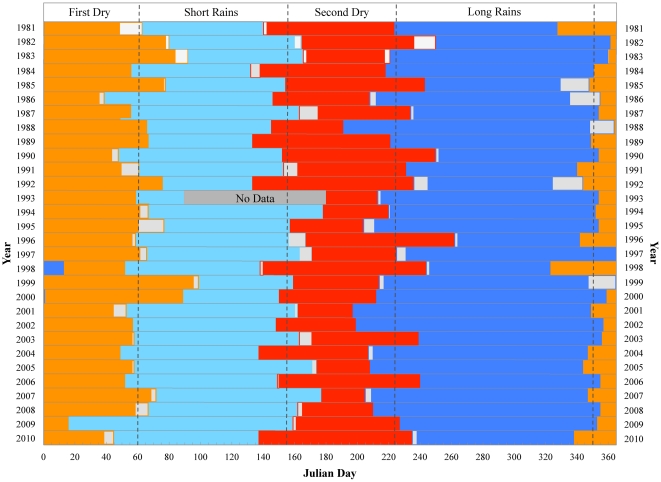
Figure 2. Distribution of rainfall seasons at MUBFS, Kibale National Park for the climate normal period 1981 to 2010.
The inter-annual distribution of rainfall seasons from total daily rainfall observations at MUBFS, 1981–2010. The light gray areas indicate the difference between predicted and observed season onset dates. The vertical dashed lines represent the average season onset for the period of record. The uncertainty (the difference between the start date observed and the start date predicted using a statistical model) in season onset for 1993 is not displayed due to missing data for April, May and June.

