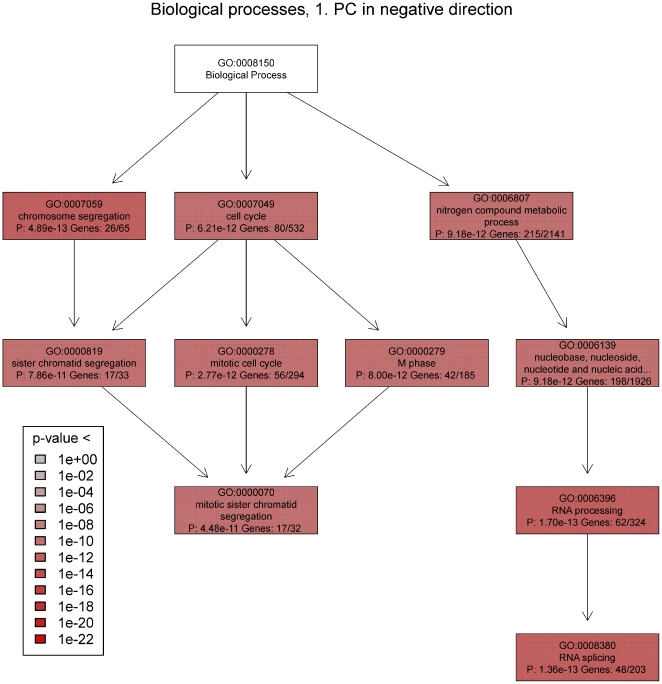
Figure 3. Negative direction PC1 gene ontology tree using 1365 probes.
Significantly overrepresented gene ontology terms (biological processes) in the negative direction of the 1st principal component using 2.5% of the most important probes were used to draw a tree graph. The gene ontology (GO) tree starts with the top term ‘biological process’ and then splits out into more specific terms. Box color indicates the p-value range. Each box contains the name of the process, the GO term number, the p-value, the number of genes in the subset and the total number of genes, which are annotated using this term. The GO tree splits into two major branches. The upper branch indicates cell division by mitosis, and the lower branch indicates mRNA processing.

