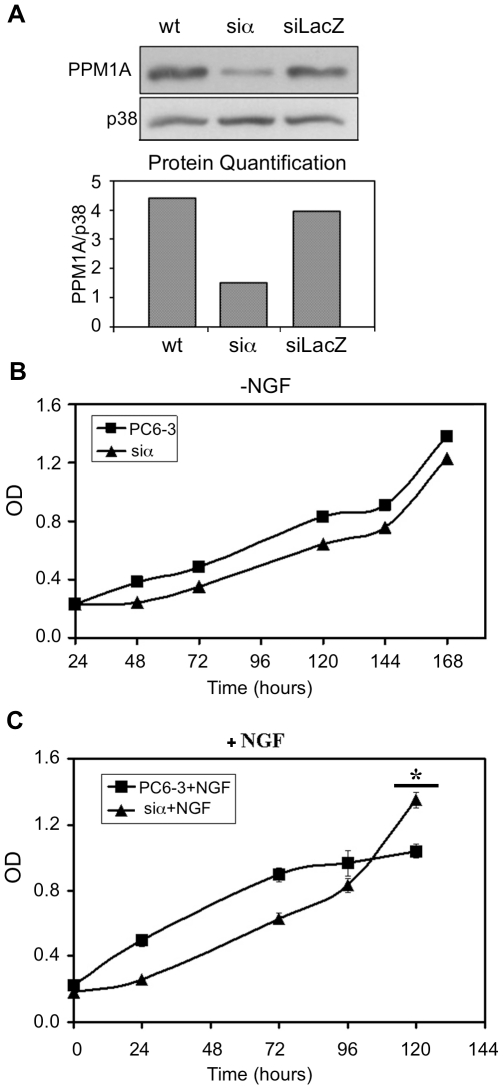
Figure 7. Proliferation assay of PPM1A knock-down cells.
( A ) PC6-3 cells were transduced with pSuperRetro-PPM1A or pSuperRetro-LacZ. Forty eight hours later cells were selected by the addition of puromycin. The protein levels of PPM1A were analyzed by western blot. The graph represents the quantification of PPM1A levels. ( B ) and ( C ) Proliferation assay of PPM1A knock-down cells compared to normal cells in the absence ( B ) or presence ( C ) of NGF. The average of 6 different wells ± standard deviation from a representative experiment out of 3 independent experiments that were performed was plotted. * P-value of 120 hours <0.002.

