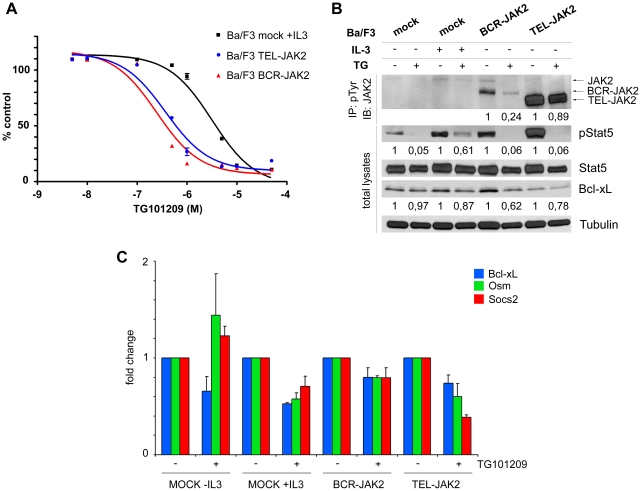
Figure 4. TG101209, a JAK2 inhibitor, down-regulates JAK2, BCR-JAK2, and STAT5 tyrosine-phosphorylation, as well as target gene expression of Ba/F3-BCR-JAK2 transduced cells.
(a) Sigmoidal dose-response curve showing viability of Ba/F3-mock growing with IL-3 (IC50 = 3180 nM) and Ba/F3-BCR-JAK2 and Ba/F3-TEL-JAK2 growing in absence of IL-3 (IC50 = 246 and 369 nM, respectively). The percentage of growth, relative to that of cells in the absence of drug, is plotted for increasing concentrations of TG101209 (where X axis is the logarithm of concentration). (b) Western blot analysis of transduced Ba/F3 cells treated for 12 h with 1 µM TG101209 (TG) or the vehicle (DMSO). Cellular lysates were immunoprecipitated with anti-pTyr Ab and immunoblotted with anti-JAK2 (upper panel). Whole cell lysates were probed with anti-pSTAT5, anti-STAT5 and anti-Bcl-xL Ab's (bottom). The expression levels of Tubulin were used as a loading control. STAT5 levels were used as a loading control for pSTAT5. (c) qPCR for Bcl-xL, Osm and Socs2 expression on Ba/F3-mock, Ba/F3-BCR-JAK2 and Ba/F3-TEL-JAK2 cells treated for 12 h with 1 µM TG101209. For comparative purposes, mRNA levels in untreated cells were normalized to 1. Bars represent fold changes of each gene after normalization with GADPH levels. Samples from three independent experiments were measured. Results are given as mean ± SEM (n = 3).

