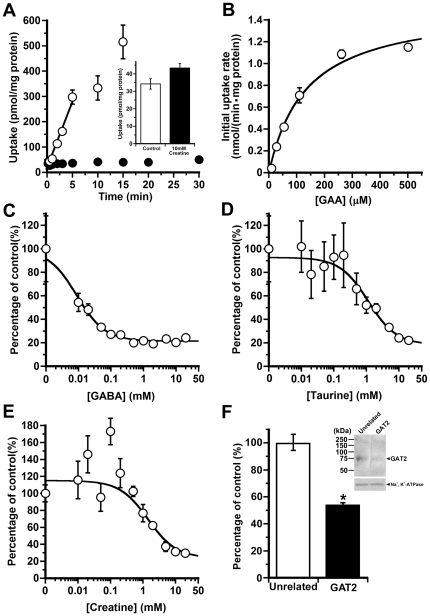
Figure 2. Characteristics of [14C]GAA uptake by freshly isolated rat hepatocytes.
(A) Time-course of [14C]GAA (18 µM) uptake (open circle) and [14C]creatine (30 µM) uptake (closed circle) by hepatocytes. Inset graph shows no effect of unlabeled creatine (10 mM) on the [14C]creatine uptake at 2 min. Each point represents the mean±SEM (n = 3–4). (B) Concentration-dependence of GAA uptake by hepatocytes. The uptake was measured at the indicated concentration for 3 min. Each point represents the mean±SEM (n = 4). (C–E) Inhibitory effect of GABA (C), taurine (D), and creatine (E) on [14C]GAA uptake by freshly isolated rat hepatocytes. [14C]GAA (18 µM) uptake for 3 min at 37°C was measured in the presence and absence (control) of each compound at the designated concentrations. Each point represents the mean±SEM (n = 3–4). (F) Effect of treatment of shRNA, unrelated or targeted to GAT2, for 24 h on [14C]GAA (18 µM) uptake by primary cultures of rat hepatocytes at 37°C for 3 min. Immunoblotting (inset) with antibodies to GAT2 and Na+, K+-ATPase used as an internal standard shows the reduction of GAT2 protein expression in GAT2-silenced hepatocytes. Each column represents the mean±SEM (n = 4). *p<0.01, significantly different from the control.

