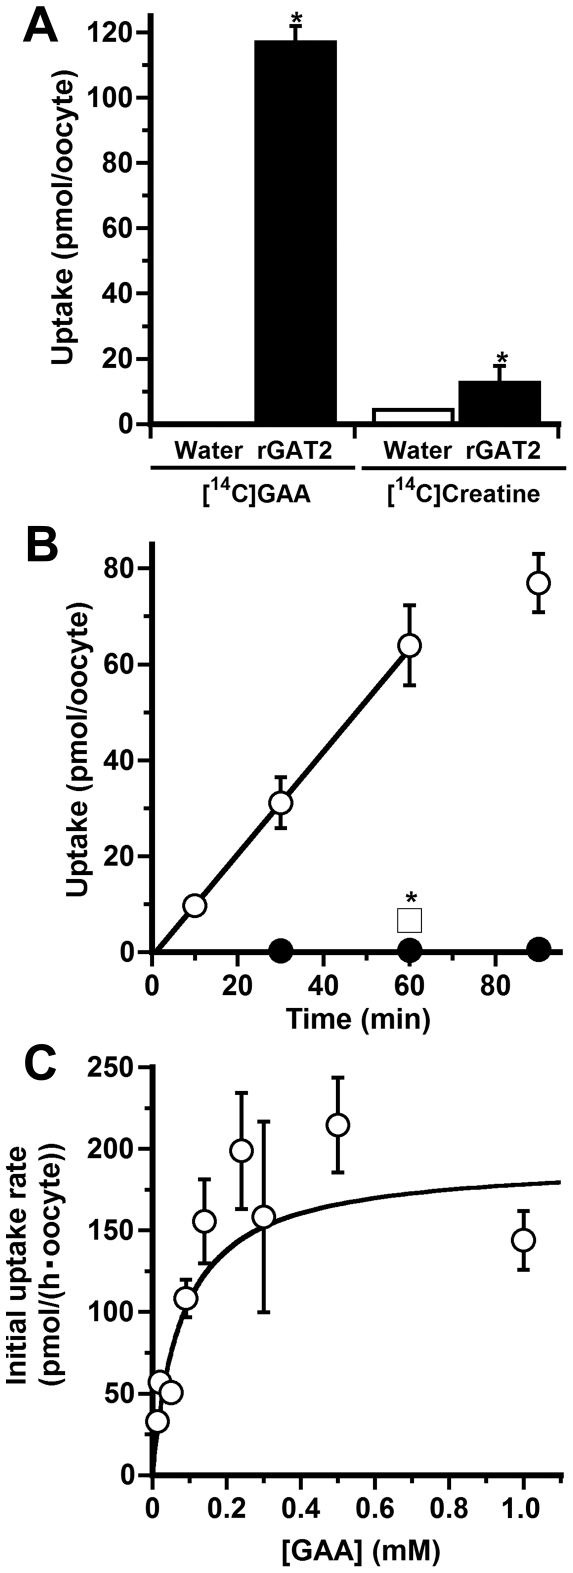
Figure 3. Characteristics of GAA transport in Xenopus laevis oocytes expressing GAT2 (GAT2/oocytes).
(A) Uptake of [14C]GAA (45 µM), and [14C]creatine (45 µM) by oocytes injected with water (Water; open column) and GAT2 cRNA (GAT2; closed column) for 1 h at 20°C. Each column represents the mean±SEM (n = 8–14). *p<0.01, significantly different from the control. (B) Time-courses of [14C]GAA uptake (45 µM) by oocytes injected with water (closed circle) and GAT2 cRNA (open circle) at 20°C. The [14C]GAA uptake was inhibited by unlabeled GAA (10 mM; open square). Each point represents the mean±SEM (n = 9–15). *p<0.01, significantly different from the control. (C) Concentration-dependence of [14C]GAA uptake by GAT2/ooccytes at 20°C. The uptake was measured at the indicated concentration for 1 h. Each point represents the mean±SEM (n = 5–15).

