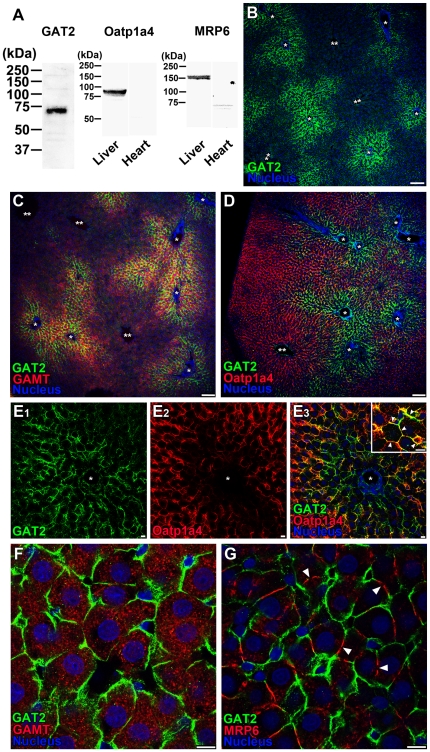
Figure 4. Expression and localization of GAT2 in rat liver.
Red and green fluorescence is defined at the lower left corner of each panel. (A) Immunoblot of GAT2, oatp1a4, and MRP6 in rat liver and heart. Rat heart was used as negative control for oatp1a4 and MRP6 expression. The size of the marker proteins is indicated to the left. (B–C) Preferential distribution of GAT2 (B and C) and GAMT (C) in hepatocytes around the portal vein. (D–E) Distribution of GAT2 and oatp1a4 in the liver. E3 inset: Localization of GAT2 on the oatp1a4-positive sinusoidal membrane (arrowheads). (F) Plasma membrane localization of GAT2 in GAMT-positive hepatocytes. (G) Double immunofluorescence of GAT2 and MRP6, a marker of the lateral membrane of hepatocytes. Arrowheads indicate the bile canaliculus. Nuclei were stained with 4′,6-diamidino-2-phenylindole (DAPI, blue). In B–E, single (*) and double (**) asterisks indicate the portal spaces and the central vein, respectively. Scale bars: B–D, 100 µm; E–G, 10 µm.

