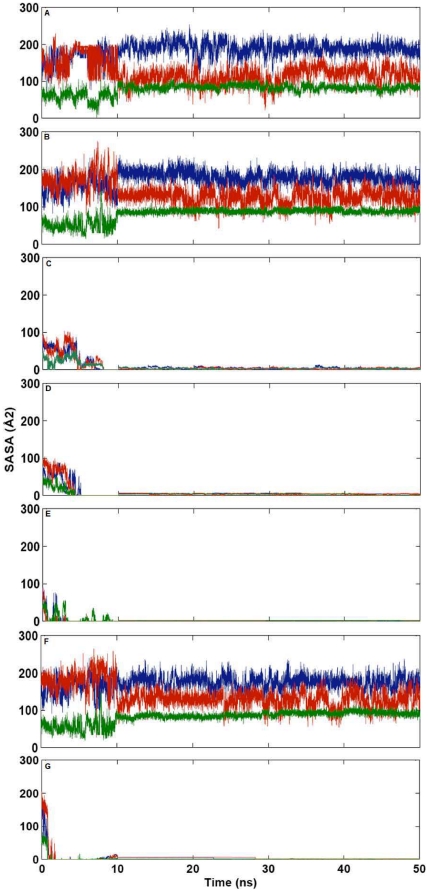
Figure 14. Computed change in solvent accessible surface area for WT-ANG and mutants.
Variation of solvent accessible surface area (SASA) of nuclear localization signal residues R31, R32 and R33 over the period of simulation (A) WT-ANG (B) K17I (C) S28N (D) P112L (E) L35P (F) K60E and (G) V113I. (R31: blue, R32: red and R33: green).

