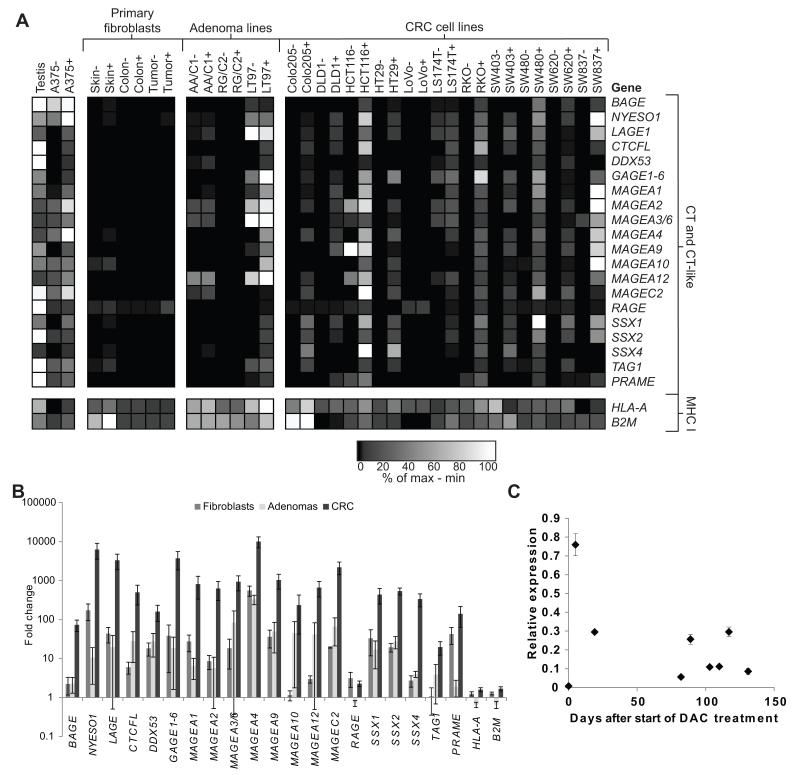
Figure 1.
Decitabine selectively induces expression of C-T genes in CRC cells. (A) Heat map demonstrating the relative expression levels of selected C-T genes, HLA-A, and B2M in primary dermal fibroblasts, cell lines derived from colonic adenomas, and cell lines derived from colorectal carcinomas, after 48-hour culture in control medium (−) or medium containing 1 μM DAC (+), as determined by RT-qPCR using a custom RT2 Profiler PCR array. GAPDH was used as the reference gene. Data are normalized across each row (corresponding to individual genes), with black representing the lowest expression level and white representing the highest expression level, and the scale indicates the percentile expression level between the minimum and maximum observed values for each gene. (B) Mean fold difference in expression of the indicated genes between control and DAC-treated fibroblasts, colonic adenoma cell lines, and CRC cell lines. (C) SW480 was treated with DAC for 48 hours and continuously cultured in vitro. Cells were collected at separate timepoints post-DAC treatment and assessed for NY-ESO-1 expression by RT-qPCR. GAPDH was used as the reference gene, and 1 represents level of expression in melanoma line A375. Error bars indicate standard error of the mean (SEM).

