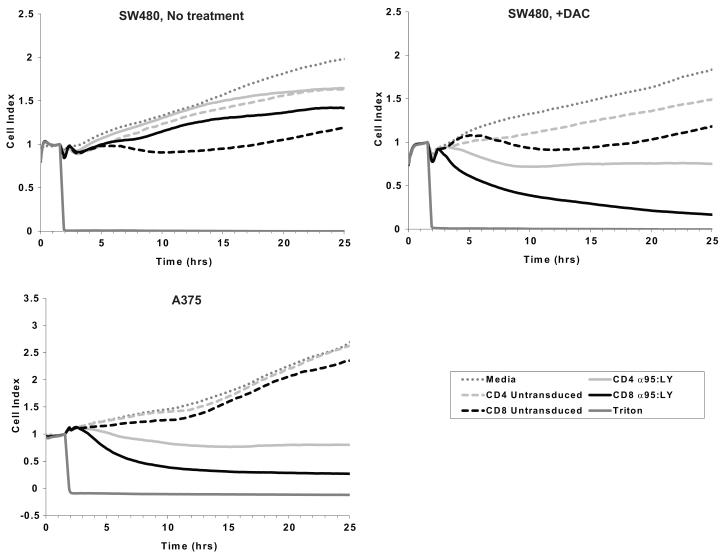
Figure 6.
Dynamic monitoring of NY-ESO-1157-165-specific T cell-mediated cytotoxicity against saline- (upper left panel) or DAC-treated (upper right panel) SW480 CRC cells and control NY-ESO-1+ A375 melanoma cells (lower left panel) using a real time cell electrical sensing system. Cells were seeded in duplicate on E-plates and allowed to attach and grow for 24 hours. Beginning at time 0, the tumor cells were cultured in T cell assay medium for 1.5 hours (dark gray dotted line), after which they were cultured in medium containing CD4+ (dashed light gray line) or CD8+ (dashed black line) untransduced T cells, CD4+ (solid light gray line) or CD8+ (solid black line) 1G4 α95:LY TCR-transduced T cells, or 1% Triton X-100 (solid dark gray line). T cells were added to the E-plates at a T cell:seeded target cell ratio of 1:1. Electrical impedance across the E-plates was continuously monitored every 5 minutes for the next 24 hours, and is reported as a Cell Index, which is normalized to 1 at the time of addition of T cells. Cell indices plotted in the figure represent the mean of duplicate samples.

