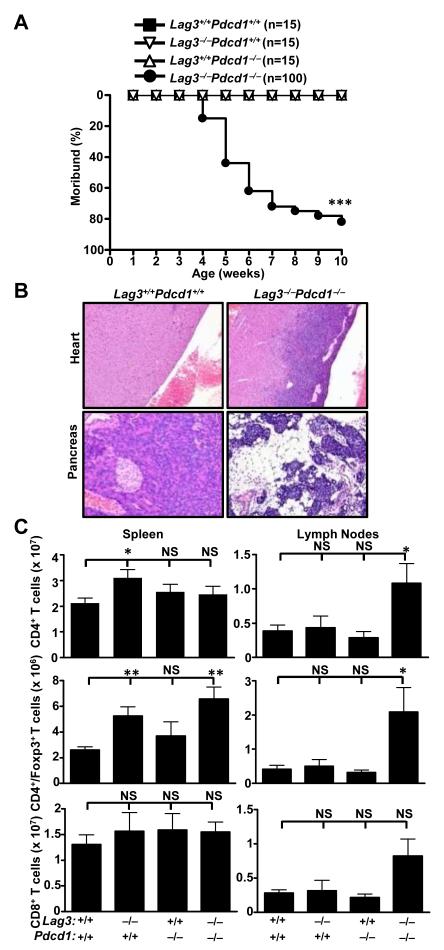
Figure 4.
Lag3−/−Pdcd1−/− mice develop lethal systemic autoimmunity. (A) Disease incidence for Lag3−/−Pdcd1−/− mice, plus single knockout and WT littermate controls. Moribund curves were analyzed for statistical significance by logrank test- *** p<0.001. (B) Representative histopathology of the heart and pancreas of WT and Lag3−/−Pdcd1−/− mice. (C) Number of various T cell populations in the spleen and LNs (inguinal and brachial) is shown. Data represent three to four independent experiments with 4-7 mice total per group (5-7 weeks old). Error bars represent SEM - * p<0.05, ** p<0.01 (unpaired t-test).

