
Figure 5.
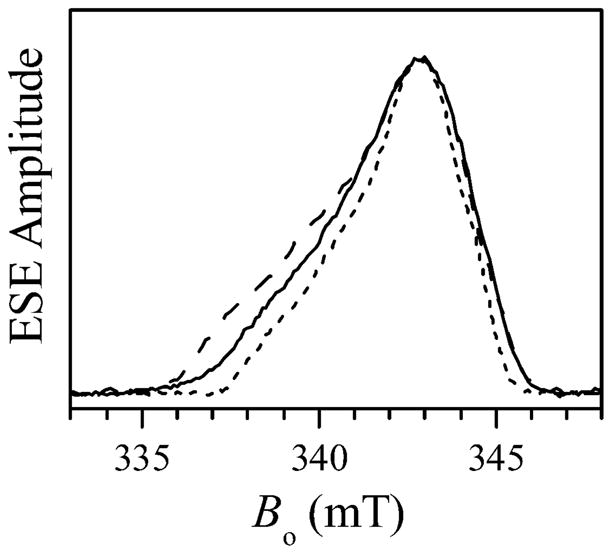
Two-pulse field sweep ESE spectra of the Mo(V) center obtained at the mw frequencies of 9.450 GHz (solid line), 11.291 GHz (long-dashed line), and 8.681 GHz (short-dashed line). The Bo scale corresponds to the solid line spectrum (νmw = 9.450 GHz). The other two spectra are only presented to show the linewidth variation with νmw. The true Bo positions for the long-dashed (νmw = 11.291 GHz) and short-dashed (νmw = 8.681 GHz) spectra are, respectively, about 66.5 mT higher and 28 mT lower that those shown in the Figure. Other experimental conditions: mw pulses, 10 and 15 ns; time interval between the mw pulses, τ = 410 ns; temperature, 10 K.