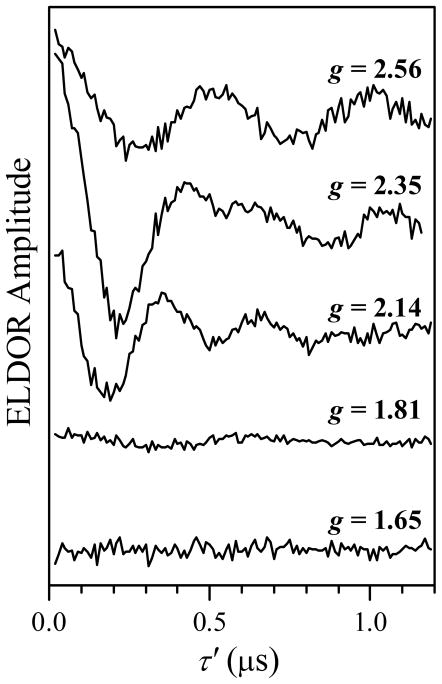
Figure 6.
ELDOR traces obtained at various EPR positions across the Fe(III) EPR spectrum (as indicated by the g-values). The ELDOR pulse sequence is shown in Figure 3a. The traces have been normalized by the ESE amplitude at τ′ → 0 and by (kmat/gobs), as explained in the text, and then the non-oscillating component was subtracted from them. The Mo(V) signal was used for pumping, and Fe(III) for observation. The mw frequencies and magnetic fields are listed in Table 1. Other experimental conditions: observation mw pulses, 10 and 15 ns; pumping mw pulse, 9 ns; τ = 1270, 1170, 1500, 1240, and 1400 ns for the traces obtained at g = 2.56, 2.35, 2.14, 1.81, and 1.65, respectively; temperature, 10 K.

