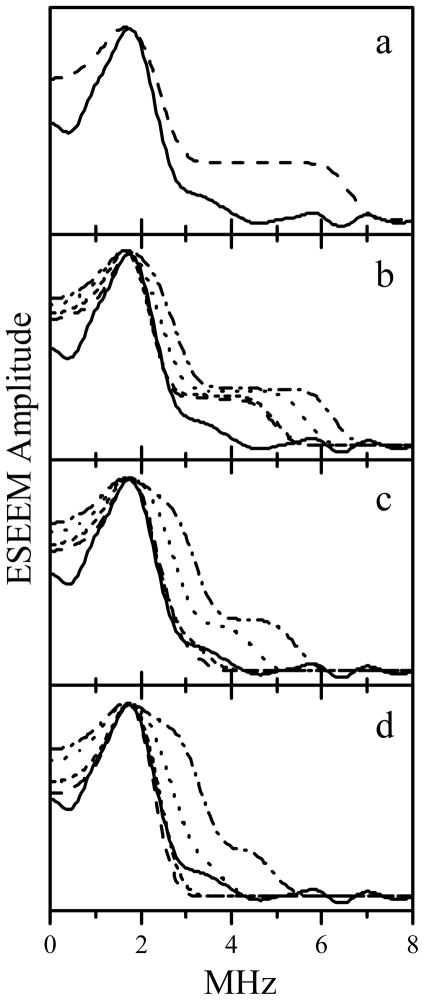
Figure 9.
Comparison of experimental FI RIDME spectrum of Mo(V) with the simulated dipole interaction spectra. The solid trace in each panel is the experimental FI RIDME spectrum, the same as trace 5 in Figure 8. Dashed, short-dashed, dotted, and dash-dotted traces in all panels are simulated with parameters described in Table 2. To emulate the experimental line width, the simulated “ideal” spectra were Fourier-transformed, truncated to a 1 μs time interval, apodized using a cosine window, and Fourier-transformed back to the frequency domain.

