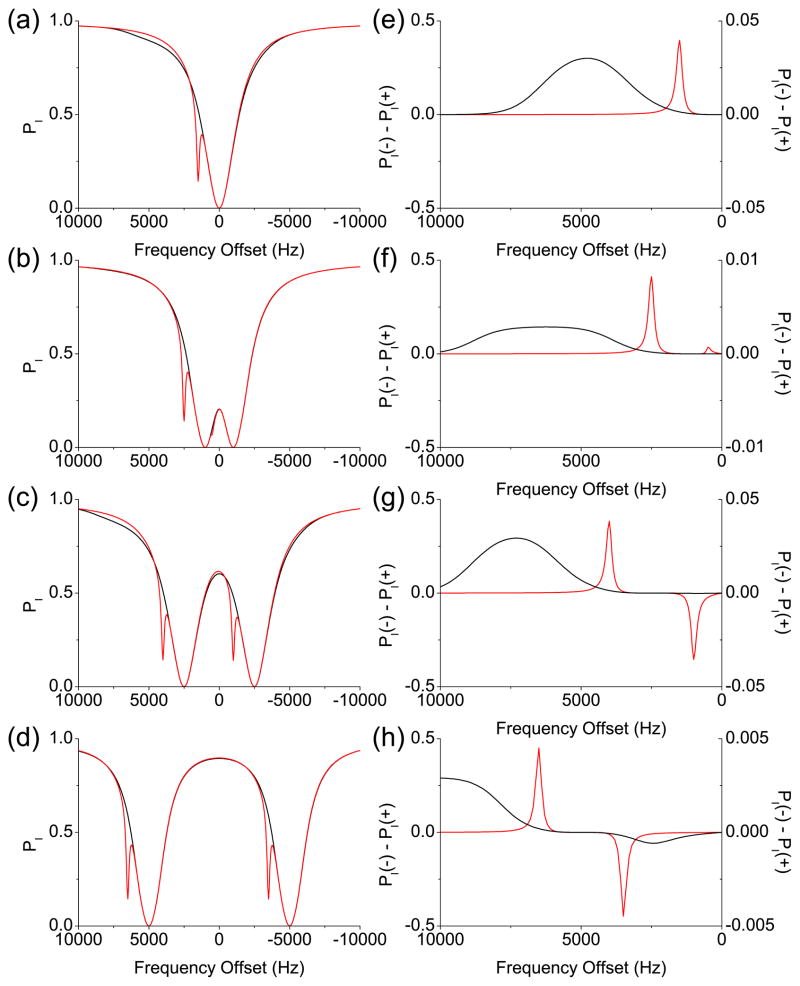
Figure 1.
Simulated Z spectra and asymmetry curves from the two-pool model based on Provotorov’s theory. The black and red lines represent the MT and CEST cases, respectively. (a) Z spectra after 5 s-long single-frequency rf irradiation. (b)–(d) Z spectra after 5 s-long two-frequency rf irradiation. The distance between the two frequency components is (b) 2 kHz, (c) 5 kHz, and (d) 10 kHz, respectively. (e)–(h) The asymmetry curves corresponding to (a)–(d). The scales for the asymmetry curve from the MT case are separately indicated on the right.

