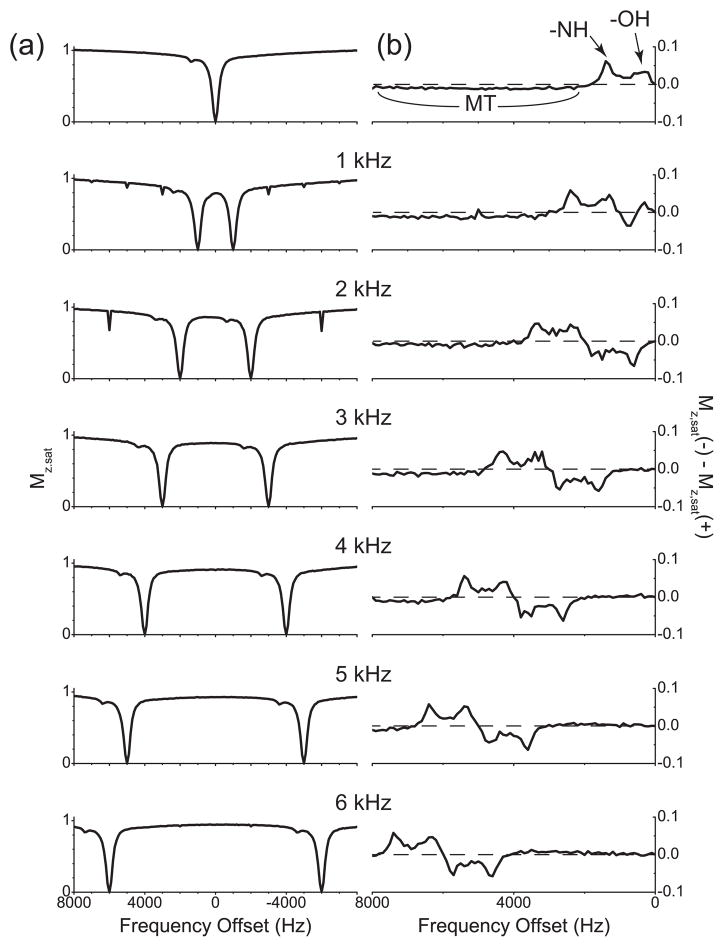
Figure 3.
Z spectra and their respective asymmetry curves of water protons in gelatin. (a) Z spectra measured with the single-frequency rf irradiation and cosine pulses with the modulation frequencies 1 kHz, 2 kHz, 3 kHz, 4 kHz, 5 kHz, and 6 kHz. (b) The corresponding asymmetry curves calculated from the Z spectra shown in (a). The modulation frequencies of cosine pulses are indicated. The dashed line represents the zero asymmetry baseline.

