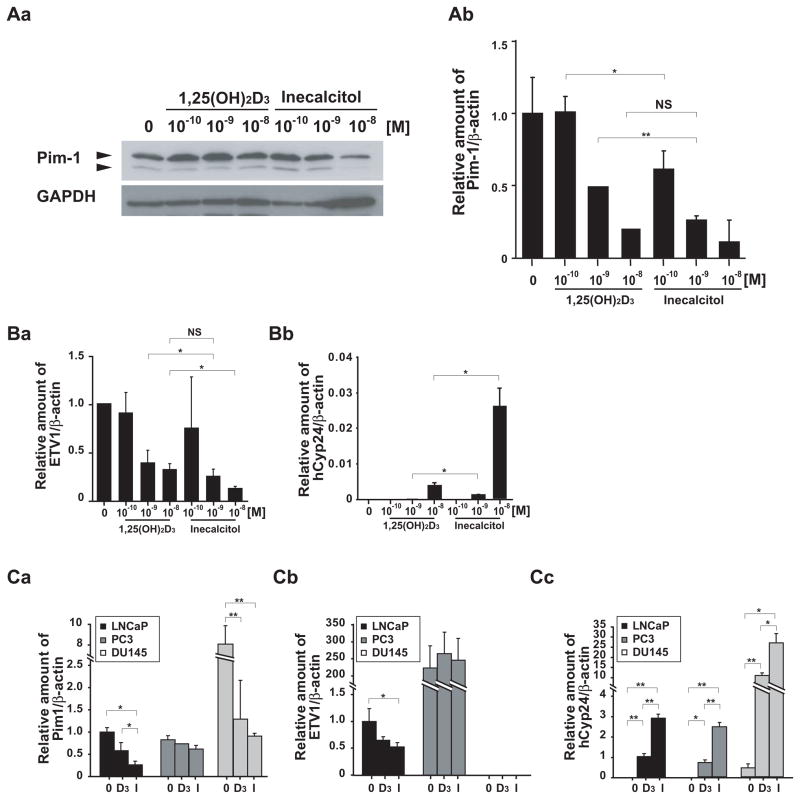
Fig. 2. Effects of vitamin D3 compounds on gene expression.
(A) Treatment with vitamin D3 compounds inhibits levels of Pim-1. LNCaP cells were treated with 10−10 to 10−8 M of either 1,25(OH)2D3 or inecalcitol for 48 h. (Aa) Pim-1 protein levels were analyzed by Western blot. (Ab) Pim-1 mRNA levels were measured by qRT-PCR, and the expression levels were normalized with β-actin. (B) Treatment with vitamin D3 compounds modulates genes expression in a dose-dependent manner. LNCaP cells were treated with 10−10 to 10−8 M of either 1,25(OH)2D3 or inecalcitol for 48 h. The mRNA expression levels of (Ba) ETV1 and (Bb) human Cyp24 (hCyp24) were measured by qRT-PCR, and the levels were normalized with β-actin. (C) Comparison of gene expression pattern in LNCaP, PC-3 and DU145 cell lines. The cells were treated with 10−8 M of either 1,25(OH)2D3 or inecalcitol for 48 h and mRNA expression of (Ca) Pim-1, (Cb) ETV1 and (Cc) hCyp24, as well as, β-actin were quantitated by qRT-PCR. The results are normalized to β-actin levels, and displayed as means and SDs of triplicates. *, p<0.05; **, p<0.01; NS, no significant difference; 0, Control; D3, 1,25(OH)2D3; I, inecalcitol treatment.

