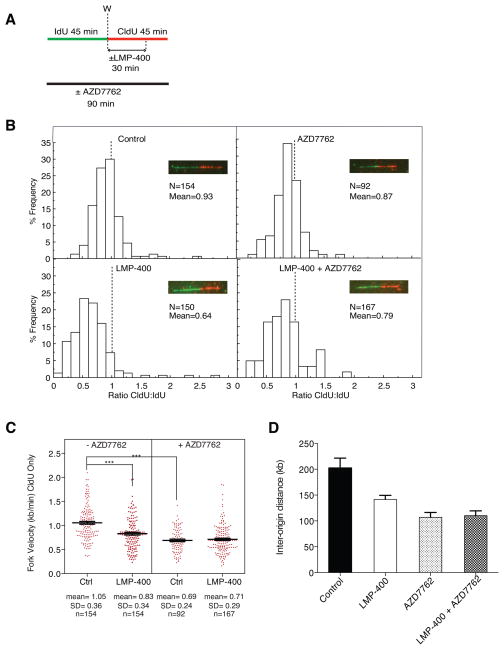
Figure 4. Effects of LMP-400 and AZD7762 on replication fork velocity and origin firing.
A) Treatment protocol. B) Distribution of Idu:CldU ratios (red:green signals) determined in single DNA molecules after molecular combing; N = number of signals measured. C) Fork velocity responses to LMP-400 and AZD7762 alone or in combination. Each dot represents a data point for an individual DNA fiber. Mean, standard deviation (SD) and number of signals measured (N) are indicated under each scatter plot. D) Inter-origin distances measured for each treatment. A minimum of 30 inter-origin distances were taken to measure their average distance. The bars represent SD. All data are representative from at least three independent experiments.

