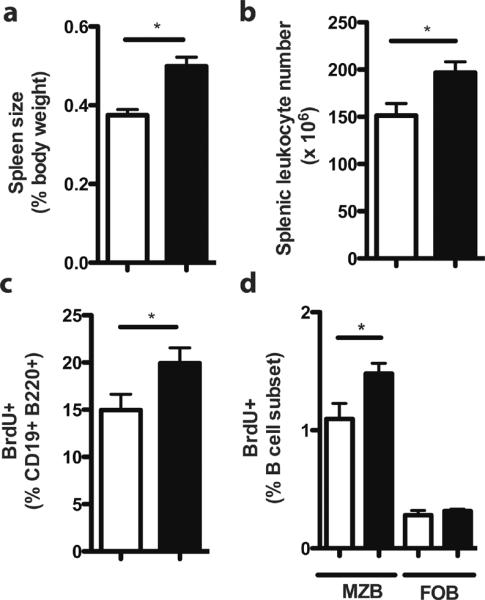
Figure 2. RP105−/− mice exhibit increased baseline spleen size, splenic leukocyte number and in vivo B cell proliferation.

(a) Spleen size and (b) splenic leukocytes were quantified in wild type (white bars) and RP105−/− mice (black bars) mice. Means +/− SE from a single experiment are depicted. (a) N=28 mice/genotype; *P<0.0001, unpaired two-tailed t test. (b) N=12 mice/genotype; *P<0.05, unpaired, two-tailed t test. (c) In vivo baseline B cell proliferation was analyzed by flow cytometric quantification of BrdU incorporation, 48 h after i.p. injection of PBS. N=6 mice/genotype, representative of 3 independent experiments. *P<0.005, unpaired, two-tailed t test. (d) In vivo baseline B cell proliferation was quantified by flow cytometric analysis of BrdU incorporation in MZ (CD19+ B220+ CD21high CD23lo) and FO (CD19+ B220+CD21int CD23+) B cell subsets from wild type (white bars) and RP105-deficient (black bars) mice. Means +/− SE are depicted; N = 6 mice/genotype. *P<0.05 (unpaired, two-tailed t test).
