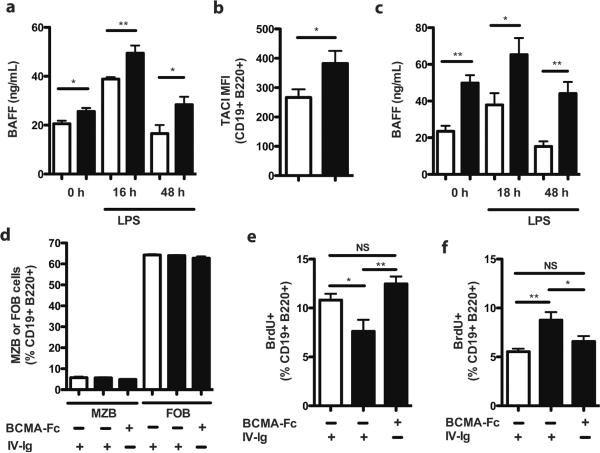
Figure 4. Dysregulated BAFF expression is integral to the altered TLR4 proliferative responsiveness of RP105−/− B cells.
(a) Kinetic analysis of serum BAFF levels from wild type (white bars) and RP105−/− (black bars) mice in response to i.p. challenge with LPS (40 μg). Means +/− SE are depicted; N=6 mice/genotype. * P < 0.05, ** P<0.005, unpaired, two-tailed t test. (b) Splenic B cell expression of TACI, 48 h after i.p. injection of PBS in wild type (white bars) or RP105−/− (black bars) mice. Means +/− SE are depicted; N=9–12 mice/genotype, pooled from 2 independent experiments, *P<0.05, **P<0.0001, unpaired, two-tailed t test. (c) Kinetic analysis of serum BAFF levels from wild type (white bars) and TACI−/− (black bars) mice in response to i.p. challenge with LPS (40 μg). Means +/− SE are depicted; N=5 mice/genotype from a single experiment, * P<0.05, ** P<0.005, unpaired, two-tailed t test. (d–f) RP105−/− (black bars) and wild type (white bars) mice were treated i.p. with BCMA-Fc (300 ng) or IV-Ig (300 ng). Six days later, (d) splenic MZ B and FO B cell subsets were quantified by flow cytometry, and (e, f) splenic B cell proliferation was quantified by BrdU incorporation, 48 h after intraperitoneal challenge with (e) LPS (40 μg) or (f) PBS. Black bars, RP105−/− mice; white bars, wild type mice. Means +/− SE are depicted, of N=8–11 mice/group (e, f), pooled from 2 independent experiments. *P<0.05, **P<0.005, ANOVA/Bonferroni post-hoc test.

