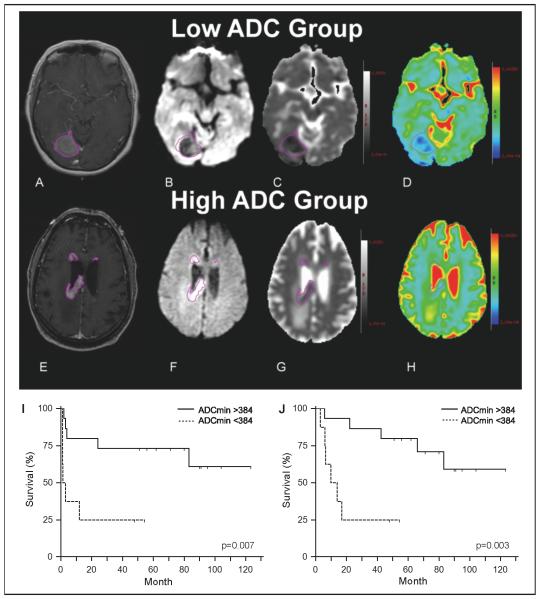
Figure 2.
Representative diffusion-weighted images: low and high ADC groups. (A and E): Contrast-enhanced T1-weighted images with regions of interest (purple) surrounding enhancing lesions obtained pretreatment in patients diagnosed with PCNSL. (B and F): Diffusion-weighted imaging with regions of interest. (C and G): Black and white ADC map with regions of interest. (D and H): Color ADC map with regions of interest. (I and J): Kaplan-Meier plots demonstrating the relationship between low intratumoral ADCmin (< 384 × 10−6 mm2/s) at time of diagnosis and shorter progression-free (I) and overall survival (J) in patients treated with MT-R induction.

