
Figure 1.
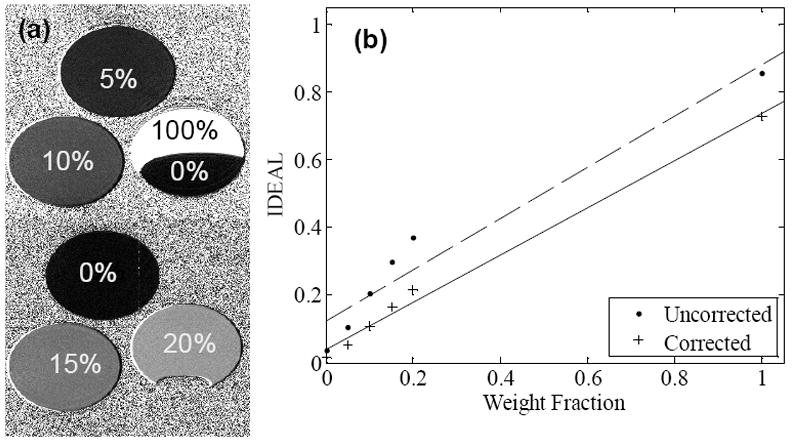
(a) Phantom RCFF images demonstrate visible differences among samples with known lipid concentrations. Note the sensitivity of the contrast between 0% and 20% lipid typical range of hepatic steatosis. (b) Phantom intensity as a function of lipid concentration with (RCFF) and without relaxation compensation.