
Figure 5.
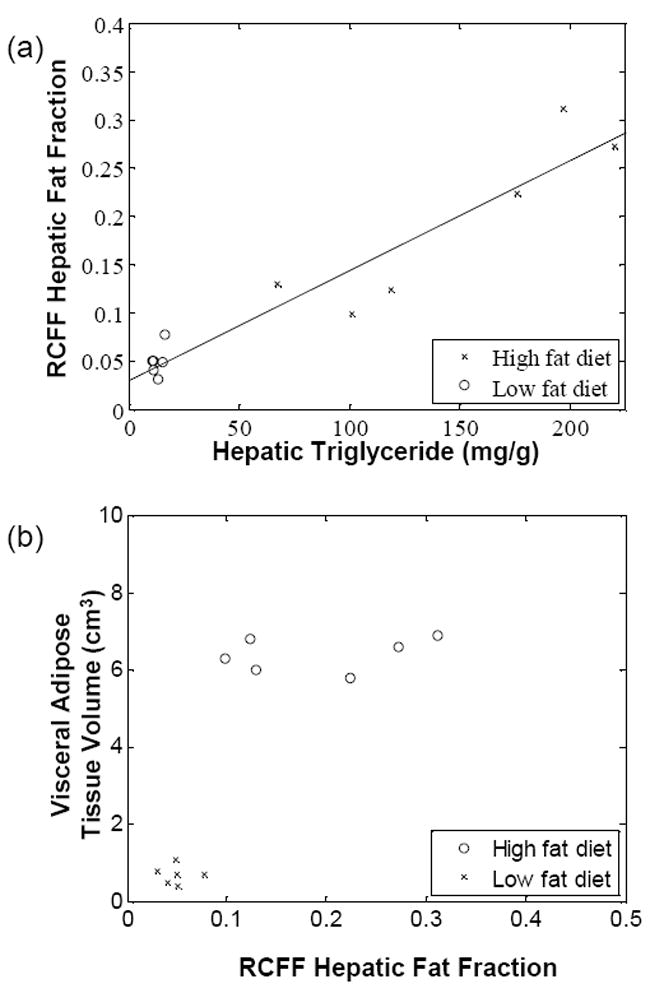
Liver triglycerides, as measured by a chemical assay (a), vary linearly with RCFF (R2=0.90). High fat diet mice had significantly higher concentrations of liver lipids, whether measured by RCFF (P=0.002) or by the chemical assay (P<0.001). A plot of hepatic fat fraction vs. visceral adipose tissue volume (b) distinguished between LFD and HFD mice. In addition, HFD animals appear to reach a maximum visceral adipose tissue volume of 6cm3.