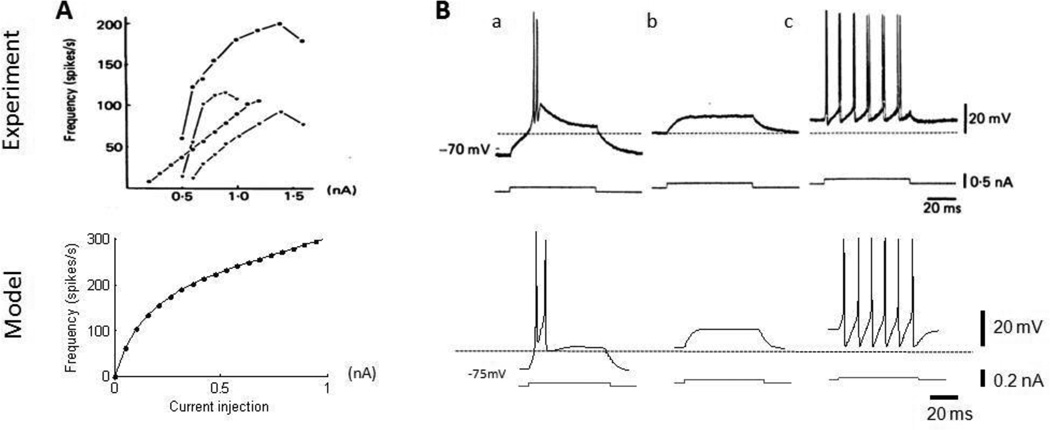
Figure 2.
(Top) Characteristics of thalamic cells from intracellular recordings (Jahnsen and Llinas, 1984); (Bottom) comparable simulation results from model assuming a cell surface area of 2625 um2 (Destexhe et al., 1998). (A) Frequency-intensity (f–i) curves of the thalamic cells. Firing rate increases monotonically with increase in current injections. (B) Typical firing patterns in a thalamic cell, including (a) rebound bursting after release from hyperpolarization, (b) subthreshold capacitive charging and discharging, and (c) train of action potentials with suprathreshold current injection.

