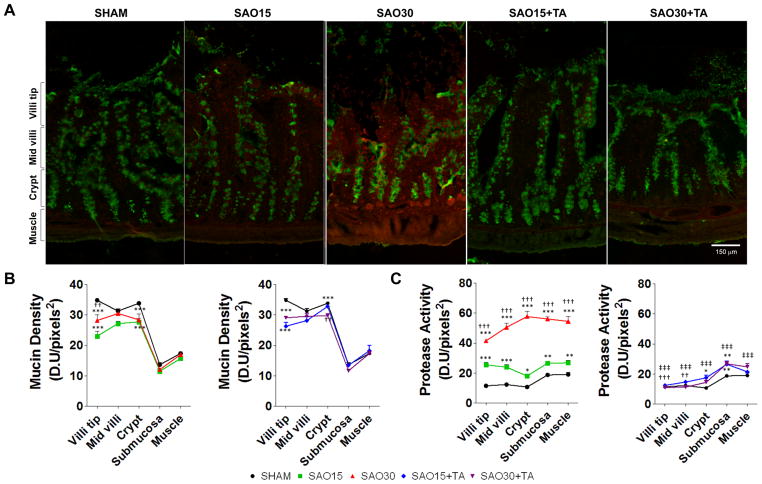
Figure 6.
Representative micrographs of jejunal frozen sections with immunofluorescent labeling against mucin2 (green) and in-situ zymography of casein substrate specific for serine proteases (red) (A). Mucin density in different regions of the villi as measured by the mean light intensity of FITC; data presented in two graphs: Sham and SAO and sham and SAO+TA treatment (B). Serine protease activity in different regions of the villi as measured by the mean light intensity of the Texas Red label; data presented in two graphs: Sham and SAO and sham and SAO+TA treatment (C). Values are mean±SEM (n=4)/group. Symbols used: SHAM (circle), SAO15 (square), SAO30 (triangle), SAO15+TA (diamond), SAO30+TA (inverted triangle).*P <0.05, **P<0.001, ***P<0.0001 compared to sham. ††P<0.001, ††P<0.001, †††P<0.0001 compared to 15 min SAO. ‡‡‡P<0.0001 compared to 30 min SAO, ##P<0.001, §§§P<0.0001 compared to 15 min SAO with TA. Figures are displayed as sham and SAO and sham and SAO plus TA for better visualization.

