Figure 8.
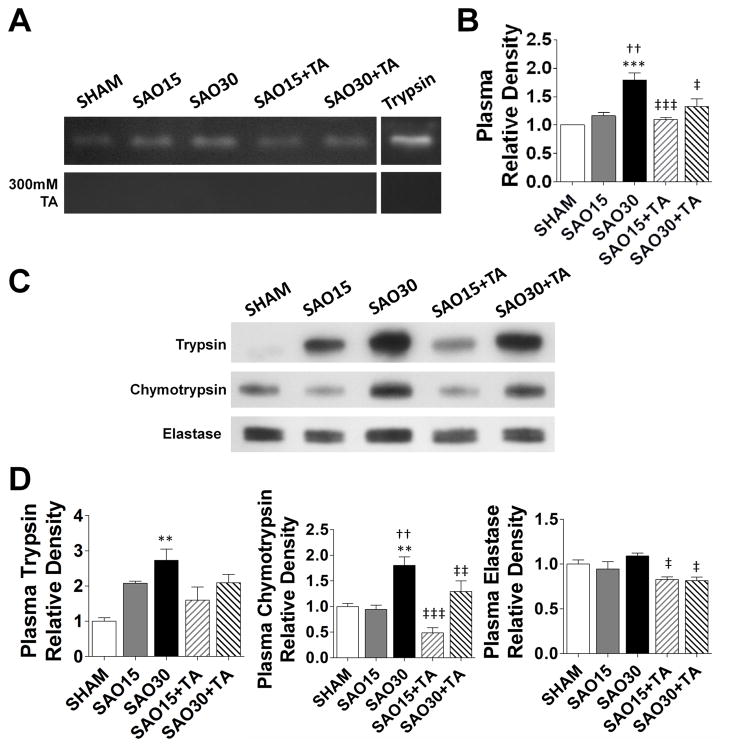
Gelatin zymography of plasma without and with Tranexamic acid inhibition during renaturing and developing steps. Bands correspond to about 20kDa molecular weight (A) Relative density of proteolytic enzyme activity, values are mean±SEM (n=4/group) (B). Western blot of trypsin, chymotrypsin, and elastase in plasma (C). Relative density of the three enzymes in plasma; values are mean±SEM (n=4/group) (D). *P <0.05, ***P<0.0001 compared to sham. ††P<0.001, †††P<0.0001 compared to 15 min SAO. ‡‡P<0.001, ‡‡‡P<0.0001 compared to 30 min SAO, §§§P<0.0001 compared to 15 min SAO with TA.

