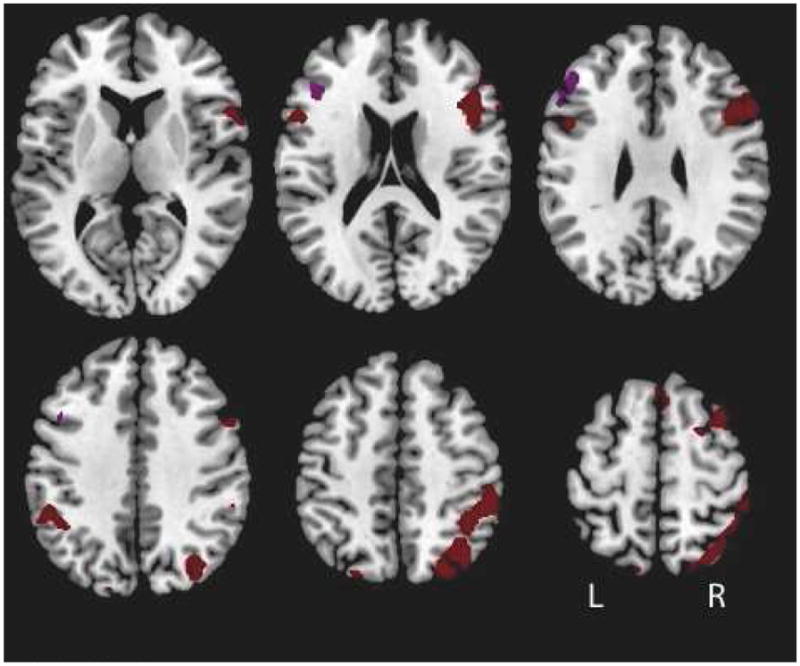
Figure 1.

Map of significant activations. A contrast of Cue B – Cue A among the sample including all subjects revealed activations within the left DLPFC (purple) and within the entire brain (brown), p < .05, FDR corrected. Activation estimates from these regions served as inputs for the classier. Peak activation coordinates are displayed in Table 3.
