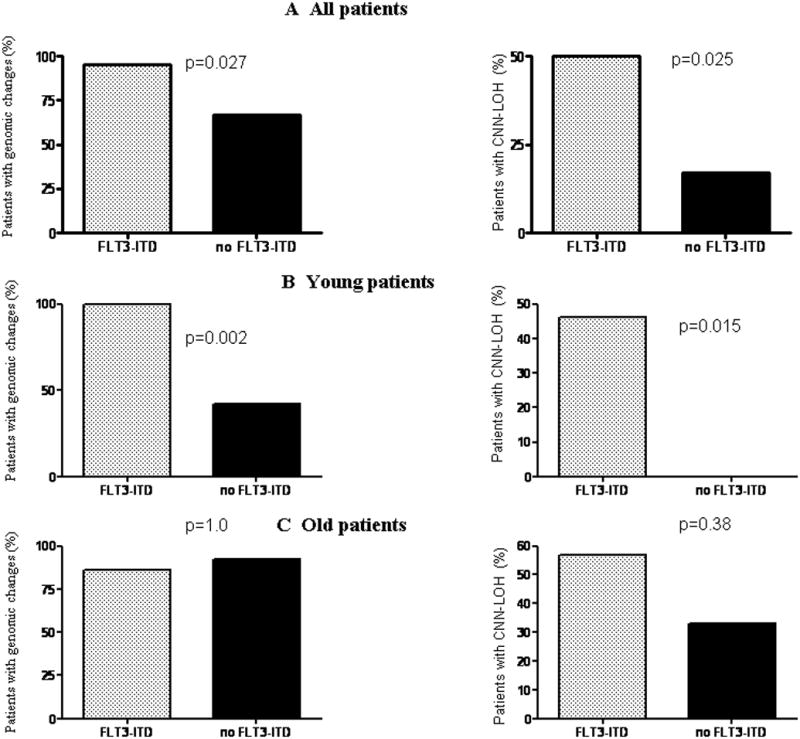
Figure 3.

Correlation of FLT3-ITD mutational data with SNP array findings. (A) Frequency of genomic changes (left panel) and CNN-LOH (right panel) in patients either with or without FLT3-ITD in the entire cohort. (B) and (C) show frequency of genomic changes (left panel) and of CNN-LOH (right panel) in young and older patients, respectively, either with or without FLT3-ITD. p = level of significance (Fisher exact test).
