Figure 6.

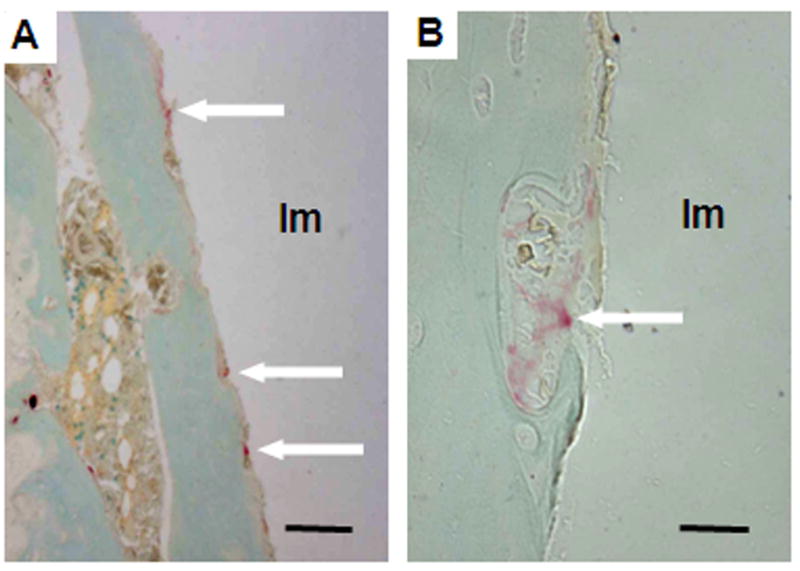
Images show TRAP positive stained cells (arrows) at the bone-implant interface of a sample in the particle-treated group. A: Scale bar is 100 μm. B: Scale bar is 10μm. Im: Implant space.

Images show TRAP positive stained cells (arrows) at the bone-implant interface of a sample in the particle-treated group. A: Scale bar is 100 μm. B: Scale bar is 10μm. Im: Implant space.