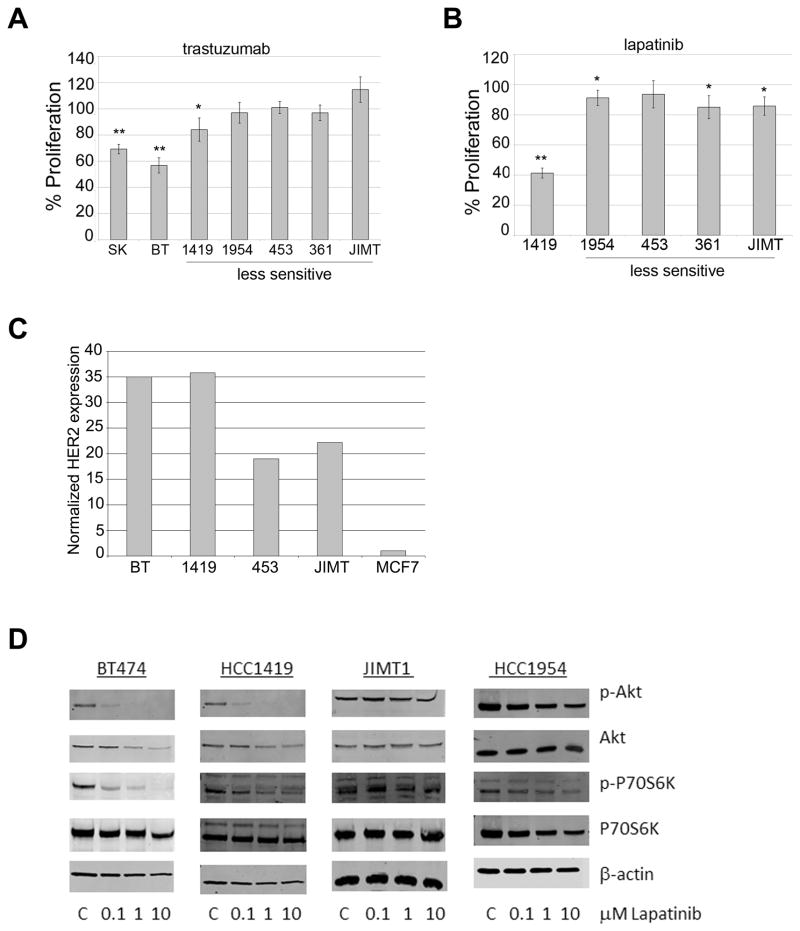
Figure 2. Analysis of anti-proliferative activity of lapatinib in primary trastuzumab-resistant HER2-overexpressing breast cancer cell lines.
Proliferation was examined by MTS assay in cell lines treated with (A) 20 μg/mL trastuzumab, or (B) 0.1 μM lapatinib for 6 days. Values represent the average of 6 replicates per group as a percentage of untreated control cells (for trastuzumab) or DMSO-treated cells (for lapatinib). Error bars represent standard deviation between replicates. P-values were determined by t-test; *p<0.05, **p<0.005. Experiments were repeated three times with reproducible results. A representative immunoblot of total HER2 is shown for all cell lines. (C) Total protein lysates of cell lines were examined by Western blotting for total HER2. Bands were quanitated and values were normalized to actin levels. Total HER2 level is shown relative to MCF-7 cell line. (D) BT474, HCC1419, JIMT-1, and HCC1954 cells were treated with 0.1, 1 or 10 μM lapatinib, or with DMSO at the volume found in the highest dose of lapatinib (C, control) for 48 h. Whole cell protein lysates were immunoblotted for p-S473 Akt, total Akt, p-T389 p70S6K, total p70S6K, or actin loading control. Blots were repeated on at least two separate occasions with reproducible results.

