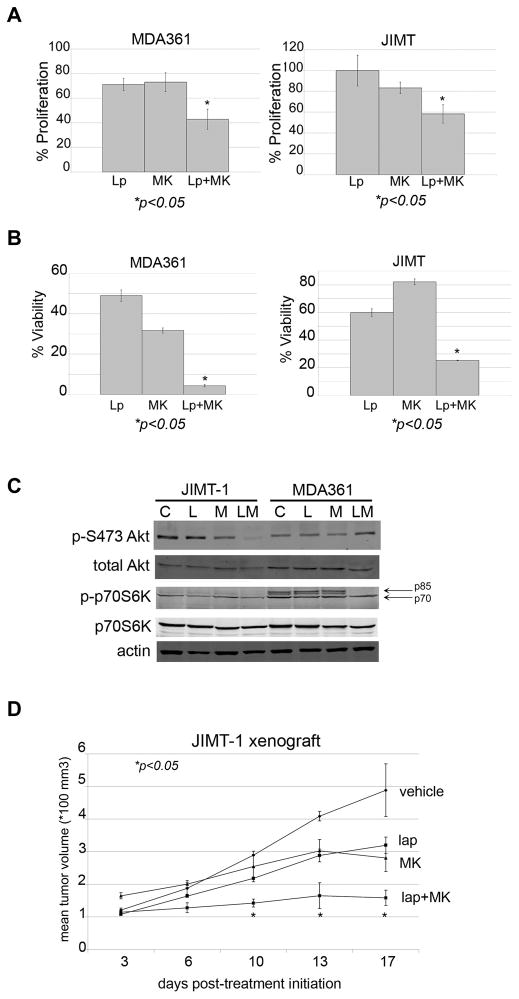
Figure 6. Efficacy of combination MK-8669 plus lapatinib in primary trastuzumab-resistant HER2-overexpressing breast cancer cells.
(A) MDA361 and JIMT-1 cells were treated with 1 μM lapatinib (Lp), 10 nM MK-8669 (MK), or a combination of 1 μM lapatinib plus 10 nM MK-8669 for 6 days. Proliferation was then measured by MTS assay. Values represent the average of 6 replicates per group as a percentage of DMSO-treated cells. Error bars represent standard deviation between replicates. P-values were determined by t-test for combination treatments versus lapatinib alone for each cell line; *p<0.05. Experiments were repeated twice with reproducible results. (B) MDA361 and JIMT-1 cells were plated in matrigel and treated with 10 nM MK-8669, 1 μM lapatinib, or a combination of 10 nM MK-8669 plus 1 μM lapatinib. Media plus drugs were changed every 3 days for approximately 3–4 weeks. Matrigel was dissolved with dispase, and viable cells were counted by trypan blue. Viability is presented as a percentage of DMSO control group, and reflects an average of 3 replicates per treatment group. Error bars represent the standard deviation between replicates. P-value was determined by t-test for combination treatment versus lapatinib alone; *p<0.05. (C) JIMT-1 and MDA361 cells were treated with DMSO (C), 10 μM lapatinib (L), 100 nM MK-8669 (M), or a combination of 10 μM lapatinib plus 100 nM MK-8669 (LM) for 48 h, lysed for total protein, and immunoblotted for p-S473 Akt, total Akt, p-T389 p70S6K, total p70S6K, or actin loading control. (D) JIMT-1 cells were injected s.c. in the flank of athymic mice. After palpable tumors formed, tumors were treated daily (5 days on, 2 days off) with vehicle control (n=2), 75 mg/kg oral lapatinib (n=2), 1 mg/kg i.p. MK-8669 (n=2), or combination lapatinib plus MK-8669 (n=3). Mean tumor volume (x 100 mm3) is shown per treatment group, with error bars representing the standard deviation between replicates. P-value was determined by t-test for combination treatment versus lapatinib alone for each day that measurements were taken; *p<0.05.

