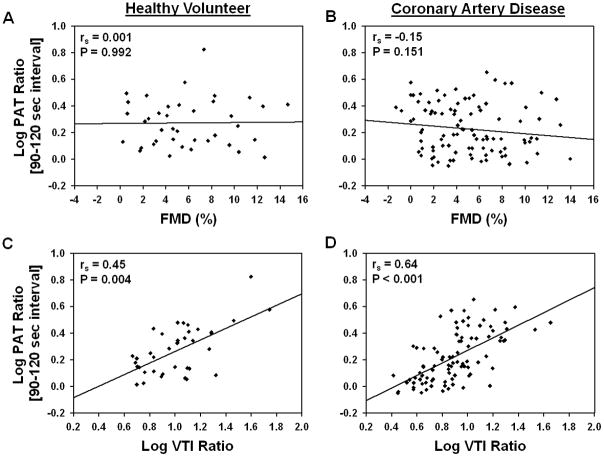
Figure 2. Correlations between digital PAT and brachial artery ultrasound phenotypes following reactive hyperemia.
Correlations between the log10-transformed digital peripheral arterial tonometry (PAT) ratio and the (A, B) brachial artery flow-mediated dilation (FMD) and (C, D) log10-transformed brachial artery velocity-time integral (VTI) ratio in the (A, C) healthy volunteer and (B, D) coronary artery disease cohorts are presented. The Spearman rank correlation coefficient (rs) and P-value for each comparison is provided.

