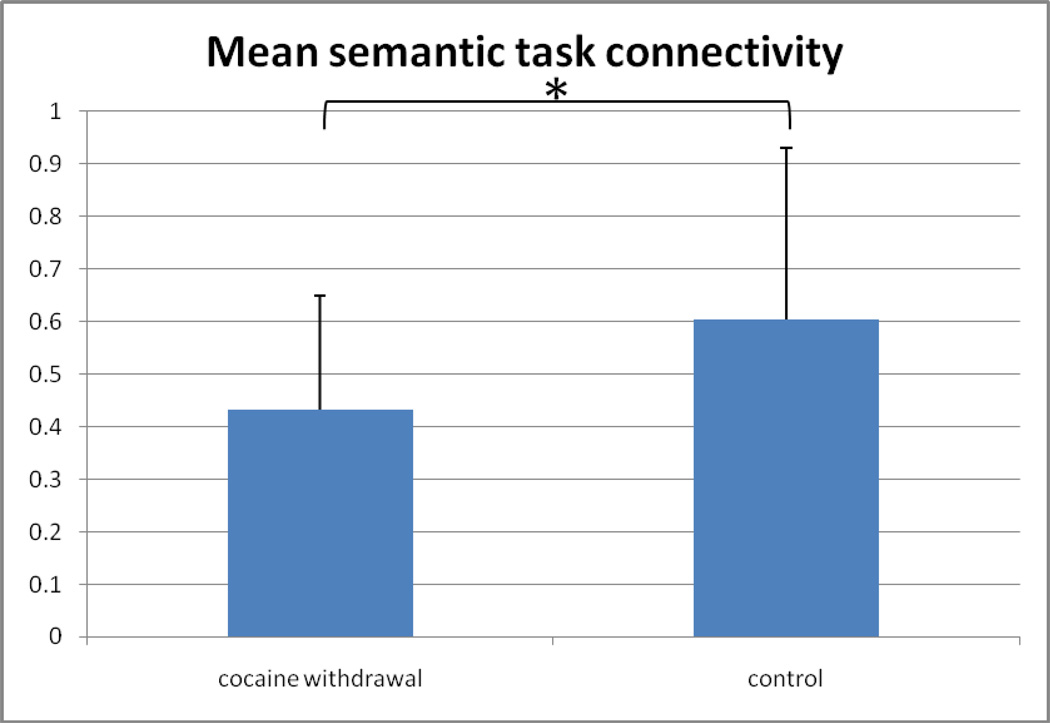
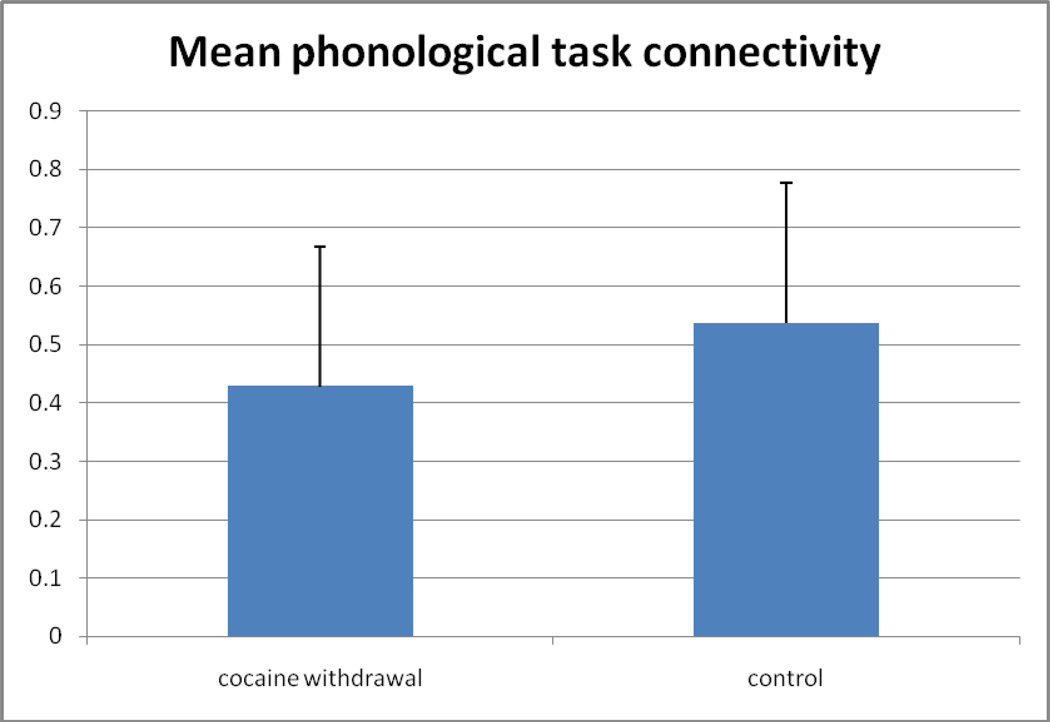
Figure 3.
Comparison of functional connectivity between groups. a) Mean z-transformed correlation coefficient (average over all ROI-pairs with standard deviation error bars) for the semantic task for both groups. b) Mean z-transformed correlation coefficient (average over all ROI-pairs with standard deviation error bars) for the ponological task for both groups. (* = p<0.01)


