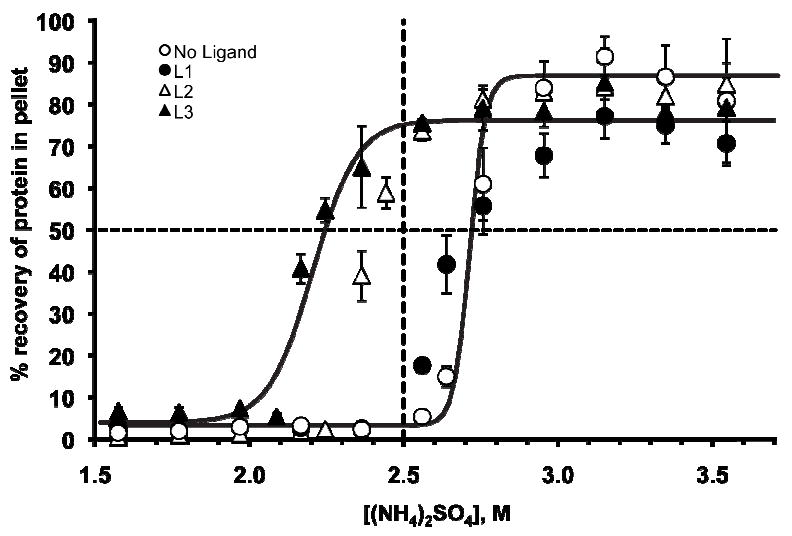
Figure 3.

The precipitation of BCA from AMS in Tris-Gly buffer (pH = 7.5, 4 °C) in the presence of L1, L2, L3 and no ligand. The concentration of each component is: [BCA]0 = 15 μM, [L1]0 = 90 μM, [L2]0 = 45 μM, and [L3]0 = 30 μM. The ratio of ligand to protein was optimized empirically to maximize the yield of precipitate. The error bars represent the deviation from three independent measurements; for clarity, we have only included the best fits (solid lines) for the experiments with no added ligand, and with L3. The horizontal dashed line represents the point at which fifty percent of the BCA was precipitated from solution and the vertical dashed line corresponds to 2.5 M AMS.
