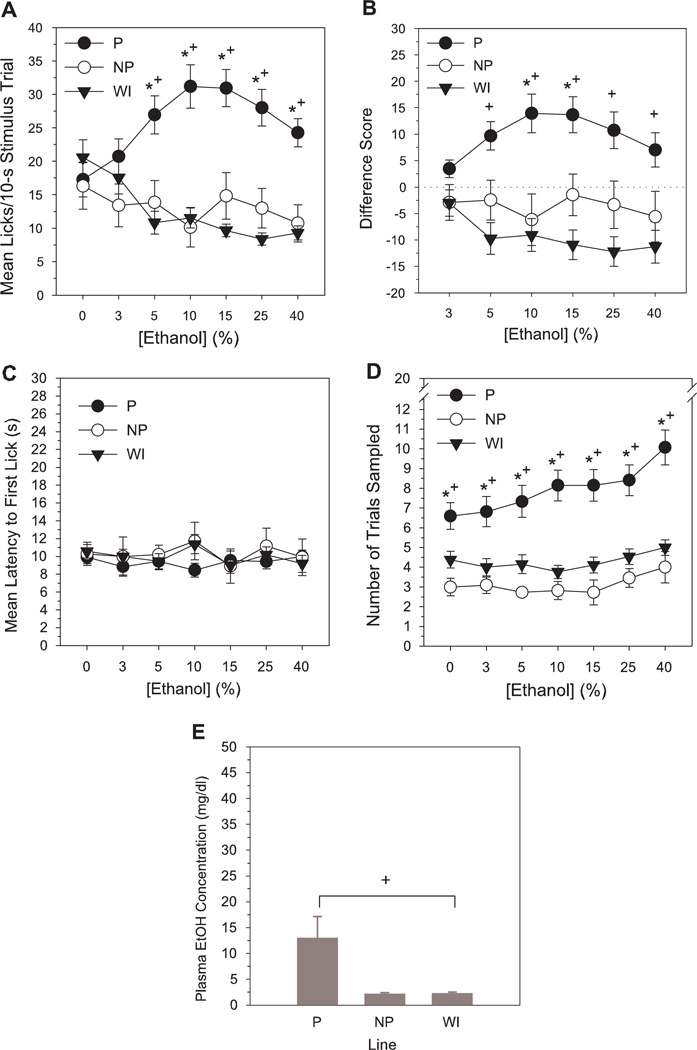
Figure 1.
Mean number of licks/stimulus trial (A), lick difference scores (B), latency to initiate licking (s) (C) and total number of trials sampled (D) for ethanol as a function of concentration in selectively bred P, NP and non-selected WI rats tested in a brief-access exposure assay assessing orosensory responsiveness. Lower panel (E) represents mean blood ethanol levels (mg/dl) in each line 1 h after the onset of their final brief-access test session. Lick difference score = mean licks to stimulus - mean licks to deionized water. Mean (±SEM) data are shown. Significant difference between *P vs NP, +P vs WI, #NP vs WI (P< 0.015).

