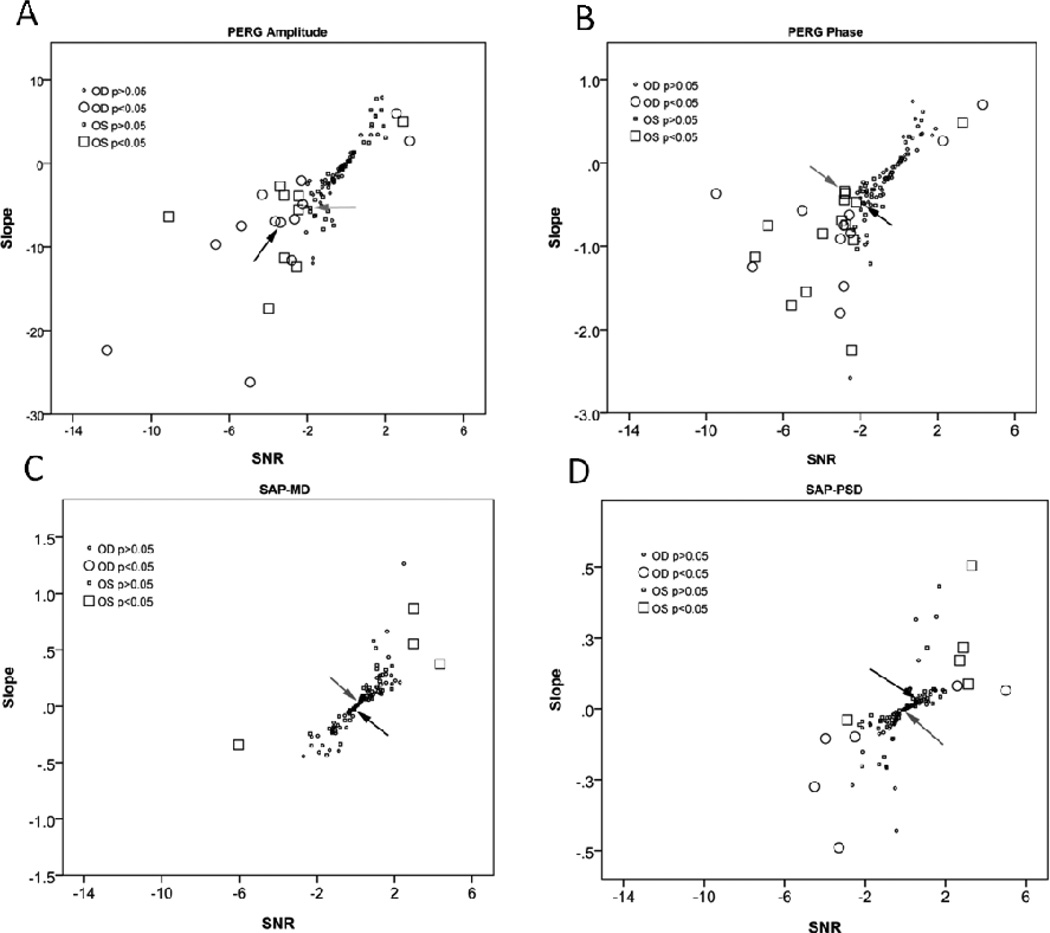
Figure 2.
Linear regression slopes calculated on individual eyes for A: PERG amplitude (% change from age-specific normal/year), B: PERG phase (ms delay from age-specific normal/year), C: SAP-MD (dB/year), and D: SAP-PSD (dB/year) as a function of corresponding signal to noise ratios (SNR). SNR is defined as regression slope divided by the slope standard error. Larger symbols mean that the regression slope was significant at P < 0.05 or less. Arrows indicate slopes corresponding to the example patient shown in Figure 1.

