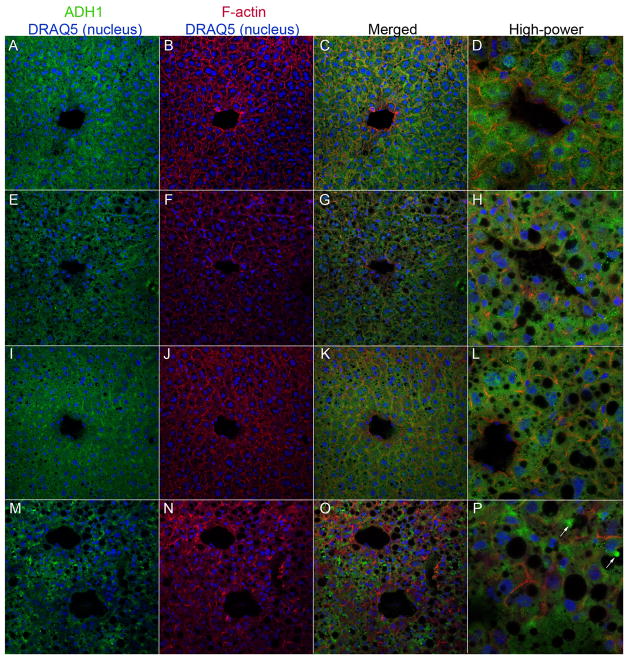
Figure 8. Changes in ADH1 localization in hepatocytes in KO mice.
Frozen liver sections were triple-stained with ADH1 antibody (FITC; green), TRITC-phalloidin (for F-actin; red) and DRAQ5 (nuclear counter-stain; blue) and images were analyzed by confocal laser scanning microscopy. Panels A–D: WT/pair-fed; E–H: KO/pair-fed; I–L: WT/EtOH; M–P: KO/EtOH. (400x magnification. Images in panels D, H, L, and P are at 800x magnification). Arrows in panel P show the aberrant localization of ADH1 in vacuolated structures within hepatocytes in the KO/EtOH group.

