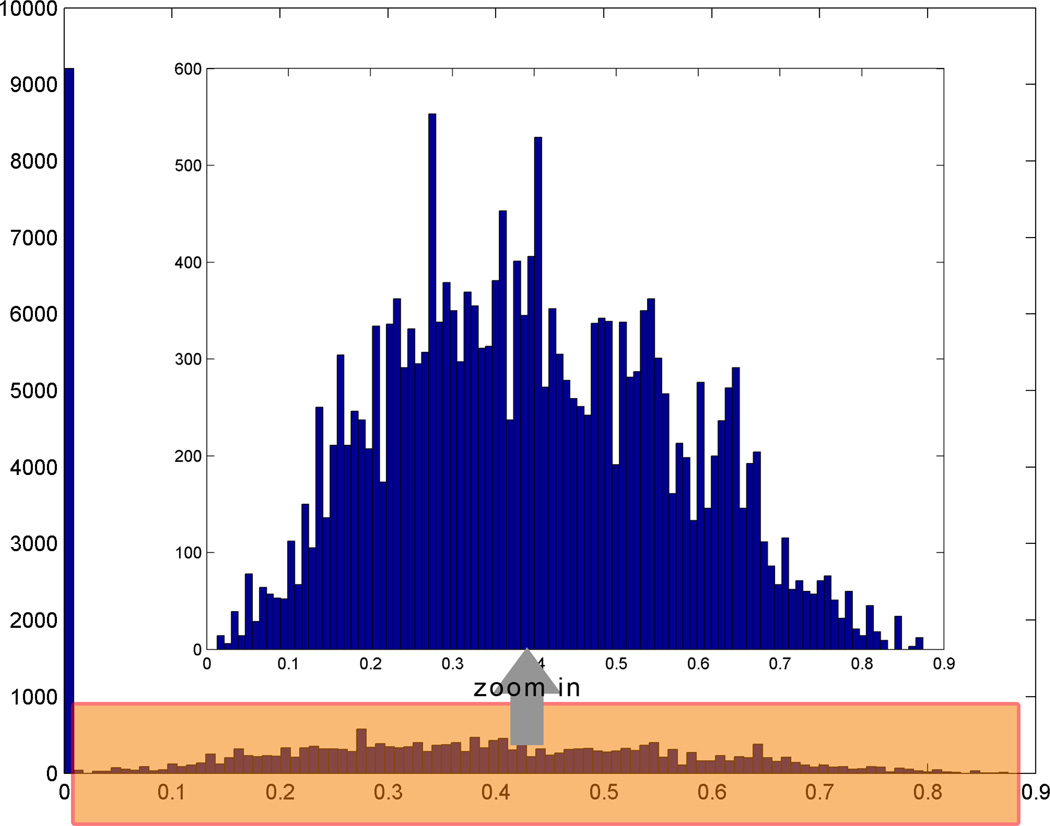
Fig. 6.
Histogram of coefficients of cross-correlation after removing voxels with very low coefficients (r<0.001). Original histogram data are scaled down heavily because of the huge population of low correlation voxels (left blue bar in the outer box). After zooming in (from the shaded box at bottom to the inner box at middle), distribution of the coefficients can better be visualized.

