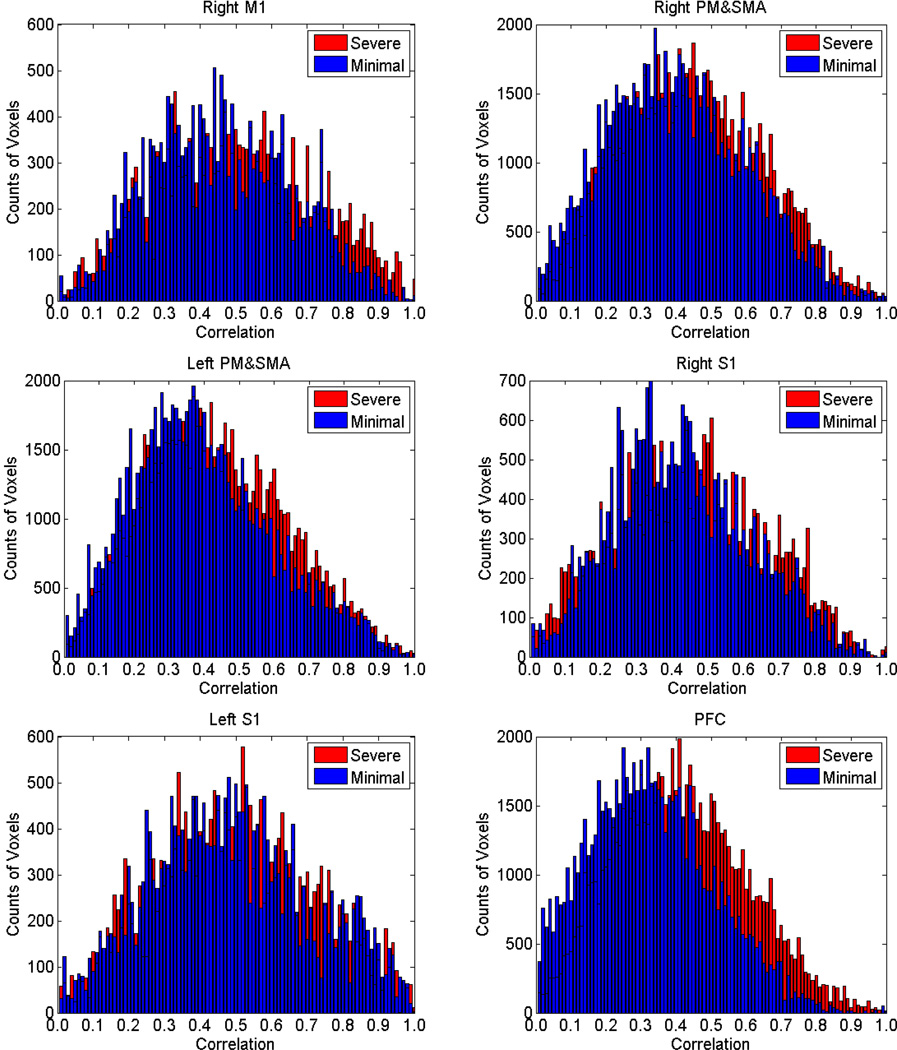
Fig. 7.
Comparisons of histogram plots of correlation coefficients over all subjects in the analyzed ROIs. Blue bins = data for minimal fatigue stage, red bins = data for significant fatigue stage. Voxels with very-low correlation (r<0.001) were excluded for better visualization of coefficient distribution of the voxels in each ROI. In the significant fatigue stage, a larger number of voxels (red bins) can be seen with higher correlation (FC with seed area) values especially in the PFC.

