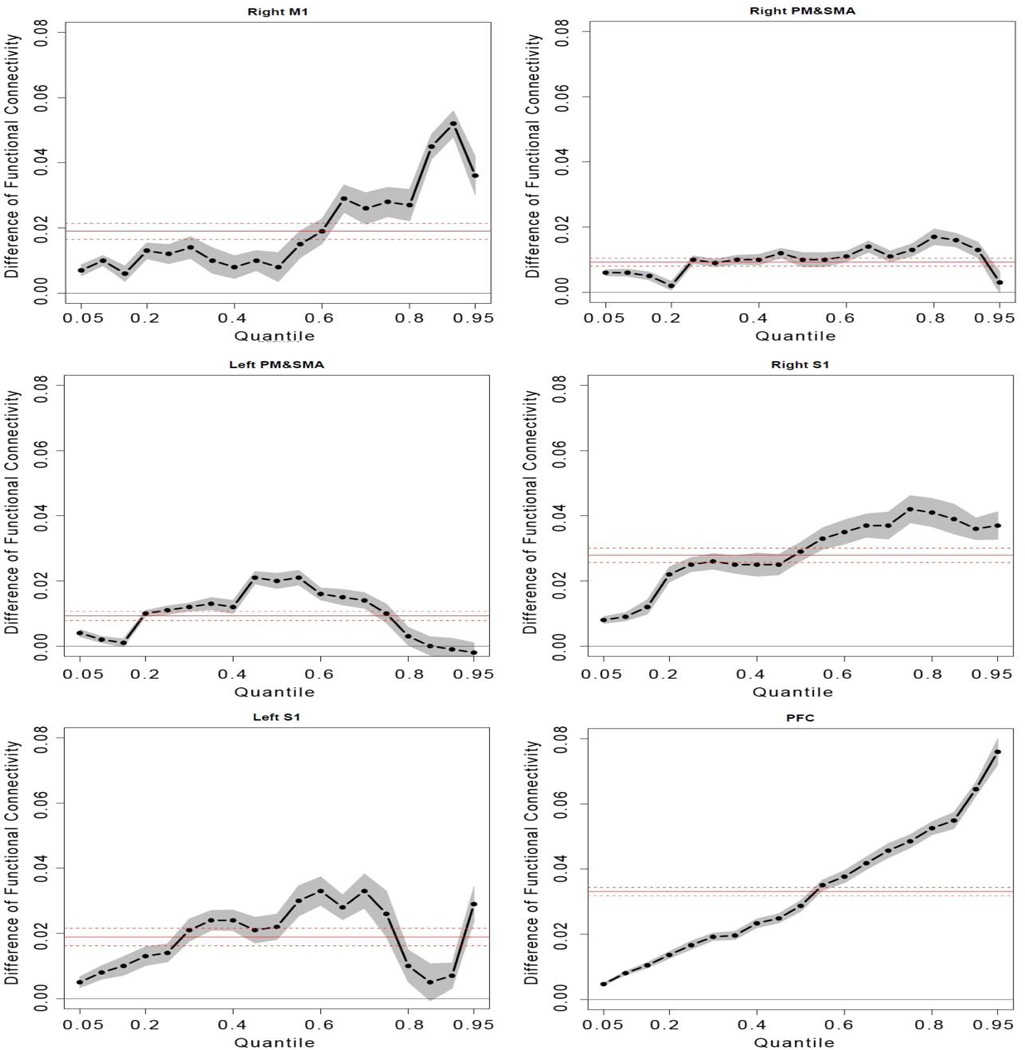
Fig. 8.
Results of quantile analysis from comparisons of coefficients of cross-correlation (FC) between minimal (first 100s) and significant (last 100s) fatigue stages. Comparisons were made at each quantile of the distribution curve between minimal and significant fatigue conditions in each ROI. Because more voxels exhibited very high FC under significant fatigue condition (such as PFC in Fig. 7) or voxels with moderate FC under minimal fatigue increased FC level with significant fatigue (such as left PM&SMA), the pattern of FC changes differed from one ROI to another. The quantile analysis adds new information to the ANOVA results indicated by the solid red line (mean FC difference) in each plot.

