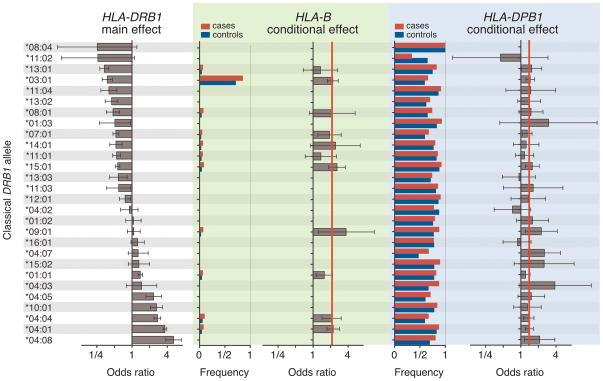
Figure 5. Conditional haplotype analysis.
Each row refers to a single classical HLA-DRB1 allele. In the left box, the main (univariate) effect is plotted as an odds ratio (with 95% confidence intervals) for each DRB1 allele (versus not having that allele), sorted in order of rheumatoid arthritis risk. In the middle box (in green), case and control allele frequencies and odds ratios are plotted for the HLA-B Asp-9 allele. In the right box (in blue), case and control allele frequencies and odds ratios (with 95% confidence internvals) are plotted for the HLA-DPβ1 Phe-9 allele. The red vertical lines indicate the aggregate effects for HLA-B and HLA-DPβ1 across all DRB1 haplotypes. The Asp-9 allele in HLA-B and the Phe-9allele in HLA-DPβ1 both have consistent effects across all HLA-DRB1 haplotype backgrounds. This suggests that these three effects are additive and independent, and not the consequence of any individual extended haplotype.

